Download
1 / 39
390 likes | 556 Views
Solving the “last mile of computing problem” – developing portals to enable simulation-based science and engineering. Tom Furlani, PhD Center for Computational Research University at Buffalo, SUNY. The Role of High Performance Computation in Economic Development

E N D
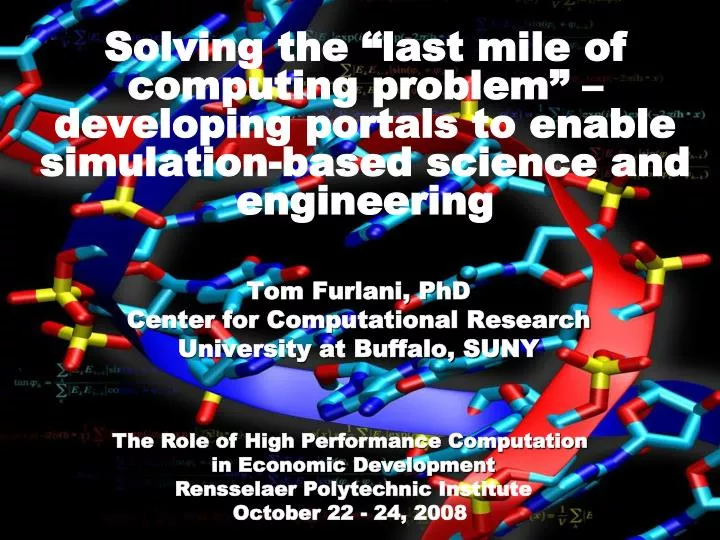
Solving the “last mile of computing problem” – developing portals to enable simulation-based science and engineering Tom Furlani, PhD Center for Computational Research University at Buffalo, SUNY The Role of High Performance Computation in Economic Development Rensselaer Polytechnic Institute October 22 - 24, 2008
Outline • How Did Computation Become so Important • Bringing HPC to the Researcher’s Desktop • Portals • Grid Computing • Example Portals • Research • Center for Computational Research • Overview • Understanding Protein Chemistry • Photoactive Yellow Protein • Toward Petascale level calculations
How did computation become critical? • Revolution in • Computing • Storage • Networking/Communication 1TB - $120. Today 1980’s 1940’s
Computing Revolution • 1890-1945 • Mechanical, relay • 7 year doubling • 1945-1985 • Tube, transistor • 2.3 year doubling • 1985-2005 • Microprocessor • 1 – 1.5 year doubling • Exponentials • Transistor density • 2X in ~18 months (Moore’s Law) • Graphics: 100X in 3 years • WAN bandwidth: 64X in 2 years • Storage: 7X in 2 years Microprocessor Revolution How long would 1 hr calc today take on a PC from 1984? 24 Years! Slide courtesy – Dan Reed, RENCI
The Storage Revolution • Megabyte • 5 MB: complete works of Shakespeare • Terabyte: 1,000,000 MB – ~$120 today • The text in 1 million books • Entire U.S. Library of Congress is 10TB of text • 50,000 trees made into paper and printed • Large Hadron Collider Experiment– 15 TB/day • Petabyte: 1000 terabytes • 20 million four-drawer filing cabinets full of text • The Data Tsunami - Many sources • Agricultural, Medical, Environmental, Engineering, Financial • Why so much data? • More sensors – higher resolution • Faster/cheaper storage capability • Faster processors – generate more data! • The challenge: extracting insight! • Without being overwhelmed
Advanced Networking • Networks are the 21st century interstate highway system • expertise and information - the real product • Removes the barriers of time and space Eisenhower Interstate System National Lambda Rail Network
Enabling SBES for Non-Experts • Bringing HPC to the desktop • Analogous to impact of Windows vs DOS for PC’s • Brought computing/internet to the home • Many users need periodic, but infrequent access • Experiment driven • Ease of use is key • Shouldn’t need to know about OS, compilers, queuing system, etc • GUI Interface, Web-based, Access anywhere • How do we get there? • Focus on development of portals, custom software and tools, data models, GUI’s, etc. • Provide training on the use of these tools • Ex: nanoHUB – one stop resource for nanotechnology
“Old School” Computing VPN software Secure Shell software Unix commands Secure file transfer Identify keywords for model Edit input file Use VPN to access network Upload input data file Add keywords to Input file Secure login to front-end machine Create subdirectory Input File PBS commands Set path and variables Edit file Monitor job Submit job to queue Create PBS script file Application command line PBS format and syntax Set number of processors Set run time and queue
Portal Driven Computing Secure login to web portal Upload input data file Select model and run job Monitor job View Output Input File Select Model Monitor Jobs Open Browser View Output in Browser
What is an Application Portal? • No consistent definition • Web-based • On-line simulation from you browser • Simulation typically doesn’t run on your PC • Doesn’t have to be grid enabled • WebMO • Computational Chemistry Portal • nanoHUB • Web-based resource for research, education and collaboration in nanotechnology • Includes application portals (tools)
Portal Basics • Remote Access to simulations and compute power V Application Server ccr.buffalo.edu Internet Authentication Export Display Run Simulation Remote Desktop
Application Portals • Benefits • Scientists able to focus on research rather than details of computing environment • Underlying infrastructure complexities are hidden • Transparently integrate compute and data resources • Moving application to a web-based interface provides ubiquitous access • Single sign-on – Don’t have to maintain accounts on many machines • Challenges • Requires close collaboration between domain experts and developers • Developers must be aware of and hide underlying complexity • Must be easy to use (web-based, GUI) • Must provide full application functionality
Grid Enabling Applications Why Needed Scientists require an ever growing amount of compute and storage resources Experiments may have requirements beyond the capabilities of a single data center Datasets are growing at a tremendous rate Grid Computing Provides infrastructure for data and job management Handles authentication of users across administrative and political domains Provides monitoring of resources and user jobs Allows researchers to harness the power of multiple datacenters for large experiments Provide reusable interface to commonly used functions: Job status, job submission, file management
Example Portals WebMO – Computational Chemistry REDfly – Bioinformatics iNquiry: Common web interface to many command-line tools GenePattern: Scientific workflow and genomic analysis tools
CCR Computational Chemistry Portal • Based on WebMO: • www.webmo.net • CCR portal: webmo.ccr.buffalo.edu • Extensive QC Support • Gaussian, GAMESS, NWChem, Q-Chem, Mopac, Molpro, Tinker • Interfaces with batch queues on U2 and several faculty clusters CCR iNquiry Bioinformatics Portal, Glimmer page
Computational Chemistry Portal • Browser based login • Menu driven
Computational Chemistry Portal • Choose level of theory
Computational Chemistry Portal • View output
Computational Chemistry Portal • ……including vibrational modes
Database/Portal Development • REDfly (Regulatory Element Database for Fly) Database of transcriptional regulatory elements • Aggregates data from multiple offline & online sources • Over 2100 entries • Most comprehensive resource of curated animal regulatory elements • Fully searchable, includes DNA sequence, gene expression data, link-outs to other databases • Extensive collaboration with other online data sources using web services
CCR Bioinformatics Portal • Based on iNquiry: • www.bioteam.net • Web portal: inquiry.ccr.buffalo.edu • Extensive Application Support • Includes popular open-source bioinformatics packages • EMBOSS, *PHYLIP, HMMer, BLAST, MPI-BLAST, NCBI Toolkit, Glimmer, Wise2,*ClustalW, *BLAT, *FASTA • Extensible for customized application interfaces • Uses U2 Compute Cluster as Computational Engine
TITAN - Modeling Geohazards • Modeling of Volcanic Flows, Mud flows (flash flooding), and Avalanches • Benefits for Developers • Developers – too much time supporting user installations • Support single web-based portal • CCR supports back-end infrastructure • Frees developers to focus on improving the models, science • Integrate information from several sources • Simulation results • Remote sensing • GIS data • Web enable for remote access
Metrics on Demand Portal • UBMoD: Web-based Interface for On-demand Metrics • CPU cycles delivered, Storage, Queue Statistics, etc • Role based interface (User, Faculty, Staff, Admin) • Available in open source :
Center for Computational Research • Under NYS Center for Excellence in Bioinformatics & Life Sciences • Moved to New Buffalo Life Sciences Complex Building • Leading Academic Supercomputing Site • Mission: “Enabling and facilitating research within the University community” • Enable Research by Providing • high-end computing and visualization resources, software engineering, scientific computing/modeling, bioinformatics/computational biology, scientific and urban visualization, advanced computing systems • Industrial Outreach/Technology Transfer to WNY • Education, Outreach and Training in WNY
2007 Highlights • Computational Cycles Delivered in 2007: • 224 different users submitted jobs (88 research groups) • 354,447 jobs run (almost 1000 per day) • 700,000 CPU days delivered • 200 new user accounts created • CIT/CCR Collaboration to Improve Research Computing • Condor deployment • Portal/Tool Development • Make machines easier to use • WebMO (Chemistry) • iNquiry (Bioinformatics) • UBMoD (Metrics on Demand) • Accountability • On-line real-time metrics • UB 2020 Campus Master Planning • 3D models of all 3 campuses • NYSGrid
CCR Research & Projects Urban Simulation and Visualization Accident Reconstruction Risk Mitigation (GIS) Medical Imaging High School Workshops Cluster Computing Data Fusion Groundwater Flow Modeling Turbulence and Combustion Modeling Molecular Structure Determination Protein Folding Prediction Data Mining – Digital Gov, Library Grid Computing Computational Chemistry Biomedical Engineering Bioinformatics
Photoactive Yellow Protein • Simple prototype of Rhodpsin family of proteins • Chromophore is located completely inside the protein pocket • Protein environment causes absorption shift from 2.70 eV (gas phase) to 2.78 eV (protein) yielding the yellow color
Chromophore Spectra Measured • Experimental spectra of the protein active site in vacuum, in a protein and in water solution • Provides insight into environmental effects on electronic spectra, large shift of absorption maximum • Can gauge accuracy of theory
Modeling the System • Combined Quantum Mechanical / Molecular Mechanical Method • System is divided into a QM part and a MM part • QM used in to model “important” part of system; MM used to model remainder • The QM part includes the active site of the protein • The MM part includes the rest of the protein, as well as surrounding water molecules QM
QM versus MM based Methods QM Calculations Advantages: Very accurate, based on first principles (ab initio, DFT - there are not empirical parameters involved), can treat bond breaking and formation Disadvantages: Time consuming, limited to small molecular systems (~100 atoms) MM Calculations QM/MM Advantages: Very fast, capable to calculate entire proteins or solutions (~100,000 atoms) Disadvantages: Less accurate, based on empirical parameters, not capable to calculate chemical reactions (electrons are not involved)
Why use the QM/MM Method? • Improved accuracy (QM) and faster (MM) • Model active site of proteins • Drug-receptor binding • Electrostatic effects • Steric effects • Interpretation of experimental data • Vibrational spectra • Electronic spectra • Mechanism of enzymatic activity • Reaction profiles • Thermal motion effects on reactivity
Modeling Protein Dynamics Goal: Understand how protein thermal dynamics effects function • Run MM based Molecular Dynamics simulation • From MD simulation, randomly select protein conformations (snapshots) • Run QM/MM simulation for each snapshot • Generate results based on averages taken from snapshots Protein dynamics time
Getting Results Faster • Carry out QM/MM calcs simultaneously for many snapshots (protein conformations)
QM/MM Calc for Each Snapshot • After MD, protein snapshots are randomly selected (1000) • Full geometry optimization of the ligand inside the fixed protein matrix (Q-Chem) • QM: DFT/B3LYP/6-31+G* (ligand) • MM: AMBER (protein + water) • Electronic excitations (Q-Chem): • QM: TDDFT/B3LYP/aug-cc-pVTZ (ligand) • MM: AMBER (protein + water) • 4500 water molecules
CPU Demand - Current Calculation • MD Simulation • 1600 CPU hours • Select 1000 Snapshots • Each Snapshot (54 CPU Hours) • Combined QM/MM Geometry Optimization • 24 CPU hours (3 hours on 8 processors) • Electronic Excitation Calc • 30 CPU Hours • Total for all 1000 snapshots + MD Simulation • 55,600 CPU Hours (2300 CPU Days)
Results Electronic excitations of the chromophore ( ) - standard deviation - change relative to the gas phase
Toward Petascale Level Calc • More accurate MD simulation • Larger water sphere (50 A radius) • ~12,000 water molecules • 500 hours on 32 processors - 16,000 CPU hours • More accurate QM/MM simulations • Larger basis set • 350 hours on 16 processors - 5600 CPU hours • Better statistics • 100,000 MD snapshots (560,000,000 CPU hours) • 2 MD simulations - 1,120,000,000 CPU hours!
Power of Parallel Processing • Assume a modest 4X increase in processor performance/computational efficiency over the next few years • Reduce requirement to about 10,000,000 CPU days • Translates to 100 CPU days on 100,000 cores • Combined QM/MM simulations of this scale possible on petascale level hardware
Acknowledgements • Portal Development • Steve Gallo, Dr. Matt Jones, Jon Bednasz, Rob Leach • Combined QM/MM Calculations • Dr. Marek Friendorf • Funding • NIH