Download
1 / 47
500 likes | 781 Views
The Great Recession. 2007-2009 The recovery has started, really. March 2012 Suzan Reagan, Labor Economist. Labor Market Information. Job Descriptions Education Wages Employment levels Future Growth. Agenda. NM Economic Situation Industry Recession History/impact of

E N D
The Great Recession 2007-2009 The recovery has started, really. March 2012 Suzan Reagan, Labor Economist
Labor Market Information • Job Descriptions • Education • Wages • Employment levels • Future Growth
Agenda • NM Economic Situation • Industry • Recession History/impact of • Current Situation • What’s Next • Occupations • Sources of Data • Career Solutions • LASER
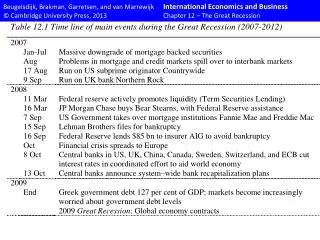
The Great Recession • Started December 2007 • Housing Peaked on 2006 • High Oil and Gas prices early 2007 • Financial Markets in August 2007
Manufacturing Values above 50 represent expansion. .
US In thousands NM NM vs. US Employment from 1990 to Present NM vs. US Employment Total Non-Farm Employment Seasonally Adjusted
How BAD? • Max September 2008: 852,900 • Min January 2011: 795,700 • Difference: -57,200 January 2008: 841,900 January 2012: 802,100 Difference: -39,800 NM Total Non-Farm Employment Seasonally Adjusted: Labor Market Supply and Demand!
NM Industries Change How Has New Mexico Handled the Recession? • Mining lost over 500 • Construction shed about 16,000 • Manufacturing lost another 8,000 • Retail took a hit with 6,000 • Admin & Waste Svs 5,000 • Bright spot Health Care +12,000 Source: Quarterly Census of Employment and Wages NM Dept. of Workforce Solutions
Central Area Industry Change Source: Quarterly Census of Employment and Wages NM Dept. of Workforce Solutions
Eastern Area Industry Change Source: Quarterly Census of Employment and Wages NM Dept. of Workforce Solutions
Northern Area Industry Change Source: Quarterly Census of Employment and Wages NM Dept. of Workforce Solutions
Southwestern Area Industry Change Source: Quarterly Census of Employment and Wages NM Dept. of Workforce Solutions
NM Employment Industry Mix Source: Projections unit 2009-2019, NM Dept. of Workforce Solutions
Current Employment Situation The unemployment rate for: January 2012 January 2011 The US is at 8.3% 9.1% New Mexico 7.0% 8.7% Albuquerque 7.1% 9.0 % Las Cruces 6.7% 8.6 % Santa Fe 5.1% 7.3 % Farmington 6.7% 9.4 % The bad news is… Seasonally Adjusted
What about… Alternative Measures of Labor Underutilization U-6 NM 14.8% Fourth Quarter of 2010 through Third Quarter of 2011 Averages. • Unemployed • Part time for economic reasons • Multiple Jobs holders • Marginally attached workers • Bureau of Labor Statistics • 4 QTR Moving Average • http://www.bls.gov/lau/stalt.htm
County Unemployment Rates 7.2 7.4 6.5 4.3 7.9 3.1 13.6 3.8 7.9 7.8 6.7 5.2 7.1 6.5 7.8 8.9 7.8 4.4 7.9 4.2 4.4 6.0 4.8 5.3 6.2 6.1 7.1 5.8 4.2 6.6 4.0 16.9 5.4
NM UI Continued Claims Duration Based on UI Summary Data 2nd Qtr 2011: Average Duration 21.5 weeks in 2010
US Unemployment Rates for Men and Women Source: US Bureau of Labor Statistics, Current Population Survey
New Mexico Unemployment Rate by Age 2011 annual averages 7.4% Source: Census Geographic Profile of Employment and Unemployment
New Mexico 2010 Unemployment Rate Source: 2010 American Community Survey 1-Year Estimates
National Trends – projected population by age Source: Population Division, U.S. Census Bureau
NM Population Projections by Age Source: U.S.Census Bureau, Population Division, Interim State Population Projections, 2005
NM Employment Projections Annual Average Percent Change 0.97
Projected 958,000 NM Job Recovery Max Employment Sept. 2008 at 852,900 Minimum Employment January 2011 at 795,700
Casselman, Ben. “A State-by-State Look at Long Road to Jobs Recovery.” Wall Street Journal Blog, November 14, 2011
O*NET / SOC 2010 Code Structure Sample code : 15-1152.00 Title: Computer Network Support Specialists Organized into Groups: 11- Management Occupations 13- Business & Financial Operations Occupations 15- Computer and Mathematical Occupations 17-Architecture and engineering Occupations 19- Life, Physical, and Social Science Occupations 21- Community and Social services Occupations 23- Legal Occupations 25- Education, Training, and Library Occupations 27- Arts, Design, Entertainment, Sports & Related 29- Healthcare Practitioners and Technical Occs. 31- Healthcare Support Occupations 33- Protective Service Occupations 35- Food Preparation & Serving Related Occs. 37- Building & Grounds Cleaning & Maintenance 39- Personal Care and Service Occupations 41- Sales and Related Occupations 43- Office &Administrative Support Wkrs 45- Farming, Fishing, and Forestry Occs. 47- Construction and Extraction Occs. 49- Installation, Maintenance, and Repair 51- Production Occupations 53- Transportation and Material Moving 55- Military Specific Occupations
NM Occupational Category Employment 2009 Source: NM Department of Workforce Solutions Economic Research & Analysis Bureau
NM Occupational Group Annual Average Percent Change 2009-2019
Occupational Employment by Education Needed Source: 2009-2019 Estimated Employment Projections Unit NMDWS
Detailed job profile for over 800 occupations • Job Description +knowledge, skills, tasks, abilities • SOC and O*NET • Training Program Completers • Classification of Instructional Programs (CIP) crosswalk Many-to-Many • Typical Education Requirements • Wage Statistics by area and industry • Employment Projections • Employment by Industry • Area’s available: • Statewide, • 4 MSA’s, • 4 Workforce Investment Regions
Tools for LMI • Career Solutions : http://www.dws.state.nm.us/careersolutions/ • LASER: http://laser.state.nm.us/ • NM Workforce Connection: https://www.jobs.state.nm.us/ • Green Jobs: http://www.greenjobs.state.nm.us • National http://careeronestop.org/ • O*NET lookup http://www.onetonline.org/ • O*NET Academy http://www.onetacademy.org/
Thank You! • Suzan Reagan • E-mail suzan.reagan@state.nm.us • Phone (505) 383-2731 • Ashley Leach , Phone (505) 383-2737