Download
1 / 69
690 likes | 825 Views
Proposed Methods for Measuring Disproportionate Minority Contact (DMC) as required by the Juvenile Justice and Delinquency Prevention Act § 223(a)(22) Revised 2002. Dr. Jeffrey Butts The Urban Institute Washington, DC jbutts@urban.org.

E N D
Proposed Methods for Measuring Disproportionate Minority Contact (DMC) as required by the Juvenile Justice and Delinquency Prevention Act §223(a)(22)Revised 2002 Dr. Jeffrey ButtsThe Urban Institute Washington, DC jbutts@urban.org Dr. William FeyerhermPortland State University Portland, Oregon feyerhw@pdx.edu
Contents • Why do we measure DMC? • Why do we need a new method of measuring DMC? • What is the new method? • What are the next steps in implementing the new method?
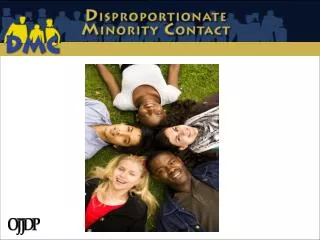
Minority?Racial and Ethnic Categories (1) White A person having origins in any of the original people of Europe, the Middle East, or North Africa. (2) American Indian or Alaska Native A person having origins in any of the original peoples of North and South America (including Central America), and who maintains tribal affiliation or community attachment. (3) Asian A person having origins in any of the original peoples of the Far East, Southeast Asia, or the Indian subcontinent including, for example, Cambodia, China, India, Japan, Korea, Malaysia, Pakistan, the Philippine Islands, Thailand, and Vietnam. (4) Black or African American A person having origins in any of the black racial groups of Africa. (5) Hispanic or Latino A person of Cuban, Mexican, Puerto Rican, Cuban, South or Central American, or other Spanish culture or origin, regardless of race. (6) Native Hawaiian or Other Pacific Islander A person having origins in any of the original peoples of Hawaii, Guam, Samoa, or other Pacific Island. Source: http://www.whitehouse.gov/WH/EOP/OMB/html/fedreg.html
Race and Ethnicity Categories in DMC • Should account for Hispanic/Latino status(e.g., “White” should include only non-Hispanic whites) • Groups more detailed than the six major groups may be used ifthey can be aggregated back into the six major groups • Any group accounting for 1% or more of the juvenile population (i.e., youth subject to juvenile court jurisdiction and juvenile justice handling) should be assessed independently • Reports should describe the categories and allocation rules used – and be consistent throughout each report Data source: www.census.gov
DMC is a Question, Not an Answer Measuring DMC is like taking vital signs in a hospital emergency room– it doesn’t identify illness or tell you how to treat it– it alerts you to potential problems and tells you where to focus your diagnostic efforts
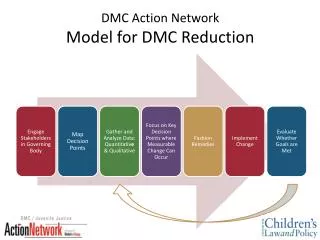
OJJDP’s Goals for DMC • Identifyexistence/extent of disproportionality– “between race” comparisons within jurisdictions and at specific decision points in the system • Assessdata about DMC to target detailed studies, identify points of needed intervention, and allocate resources for system interventions • Interveneto reduce DMC – assist policymakers in choosing jurisdictions that should receive increased attention and intervention • Evaluatehow DMC responds to policy initiatives and system interventions • Monitortrends in DMC within and across jurisdictions
The Meaning of DMC has Changed No longer disproportionate “confinement” but Disproportionate”contact”with the juvenile justice system
Contact • Initial encounter with law enforcement(i.e., arrest) and • Ongoing juvenile justice contacts, such as: • Diversion • Referral to juvenile court • Hold in secure detention • Issuance of petition • Adjudication as delinquent • Placement on probation • Placement in secure facilities • Transfer to adult court • And other points where sufficient data exist: • Pre-arrest diversion • Aftercare • Revocation of aftercare • etc.
DMC Goals are not Changing DisproportionateMinorityConfinement DMC The purpose of the DMC statute and regulation is to ensure equal and fair treatment for every youth in the juvenile justice system, regardless of race and ethnicity
DMC Goals are not Changing DisproportionateMinorityContact DMC The purpose of the DMC statute and regulation is to ensure equal and fair treatment for every youth in the juvenile justice system, regardless of race and ethnicity new
Why a New Method? Old Method DRI“Disproportionate Representation Index” New Method RRI“Relative Rate Index”
A Specific Ethnic Group All Races & Ethnicities Ratio % Total Population Confined Youth % Old Method (DRI)
Ethnic Group 1 Ethnic Group 2 # Per-capitaRate # Ratio # # New Method (RRI) Total Population Confined Youth
The New Method (RRI): • Reduces Statistical Bias• Allows Fair and Accurate Comparisons• Handles Multiple Racial/Ethnic Groups
Consider two fictional places where Latinos are twice as likely as whites to be confined: Diversityville Homogenous Town White Latino White Latino 1,000 100 1,000 200 ArrestedConfined 1,000 100 1,000 200 Confinement probability 10% 20% 10% 20% Divide Latino % of confined youth 67% 67% Latino % of all youth 50% 10% only difference Equals 6.7 DRI = 1.3 Latinos are twice as likely to be confined in both places, but the DRI distorts this equivalence
What does this mean? • The DRI is a biased estimator What other choice is there ? • Using rates instead of proportions
Developing the RRI • Creating Rates • Examining Individual Decision Points
Consider Two Hypothetical States Youth Population (Ages 10-17) State A: 225,000 State B: 225,000 Same youth population size, different demographic mix and different confinement population
Total Youth Population 20,250204,750 225,000 9%91% 100% State B Youth Confined on July 1, 2003 Total Youth Population BlackWhite Total 51060 570 89%11% 100% 160,00065,000 225,000 71%29% 100% State A Youth Confined on July 1, 2003 BlackWhite Total 60200 260 23%77% 100%
DRI 2.60.9 State A Youth Confined on July 1, 2003 Total Youth Population BlackWhite Total 60200 260 23%77% 100% 20,250204,750 225,000 9%91% 100% State B Youth Confined on July 1, 2003 Total Youth Population BlackWhite Total 51060 570 89%11% 100% 160,00065,000 225,000 71%29% 100%
DRI 2.60.9 State A Youth Confined on July 1, 2003 Total Youth Population BlackWhite Total 60200 260 23%77% 100% 20,250204,750 225,000 9%91% 100% State B Youth Confined on July 1, 2003 Total Youth Population BlackWhite Total 51060 570 89%11% 100% 160,00065,000 225,000 71%29% 100%
DRI 2.60.9 DRI 1.30.4 State A Youth Confined on July 1, 2003 Total Youth Population BlackWhite Total 60200 260 23%77% 100% 20,250204,750 225,000 9%91% 100% State B Youth Confined on July 1, 2003 Total Youth Population BlackWhite Total 51060 570 89%11% 100% 160,00065,000 225,000 71%29% 100%
DRI 2.60.9 DRI 1.30.4 State A Youth Confined on July 1, 2003 Total Youth Population BlackWhite Total 60200 260 23%77% 100% 20,250204,750 225,000 9%91% 100% Using the old DRI method, it appears that DMC in State A is twice that of State B State B Youth Confined on July 1, 2003 Total Youth Population BlackWhite Total 51060 570 89%11% 100% 160,00065,000 225,000 71%29% 100%
But, remember, the DRI is a biased estimator It is affected by the relative size of minority youth populations
Rate Ratios are unaffected by either:1. the relative proportion of minorities in the total youth population, or2. the number of different population groups that must be compared
Rate 3.20.9 State A Youth Confined on July 1, 2003 Total Youth Population DRI Rate BlackWhite Total 60200 260 23%77% 100% 20,250204,750 225,000 9%91% 100% 2.60.9 3.01.0 Confined youth per 1,000 juveniles in the general population State B Youth Confined on July 1, 2003 Total Youth Population DRI BlackWhite Total 51060 570 89%11% 100% 160,00065,000 225,000 71%29% 100% 1.30.4
Rate 3.20.9 State A Youth Confined on July 1, 2003 Total Youth Population DRI Rate BlackWhite Total 60200 260 23%77% 100% 20,250204,750 225,000 9%91% 100% 2.60.9 3.01.0 State B Youth Confined on July 1, 2003 Total Youth Population DRI BlackWhite Total 51060 570 89%11% 100% 160,00065,000 225,000 71%29% 100% 1.30.4
Rate 3.20.9 State A Youth Confined on July 1, 2003 Total Youth Population DRI Rate BlackWhite Total 60200 260 23%77% 100% 20,250204,750 225,000 9%91% 100% 2.60.9 3.0 State B Youth Confined on July 1, 2003 Total Youth Population DRI BlackWhite Total 51060 570 89%11% 100% 160,00065,000 225,000 71%29% 100% 1.30.4
Rate 3.20.9 State A Youth Confined on July 1, 2003 Total Youth Population DRI Rate BlackWhite Total 60200 260 23%77% 100% 20,250204,750 225,000 9%91% 100% 2.60.9 3.0 3.01.0 State B Youth Confined on July 1, 2003 Total Youth Population DRI BlackWhite Total 51060 570 89%11% 100% 160,00065,000 225,000 71%29% 100% 1.30.4
Rate 3.20.9 State A Youth Confined on July 1, 2003 Total Youth Population DRI Rate BlackWhite Total 60200 260 23%77% 100% 20,250204,750 225,000 9%91% 100% 2.60.9 3.01.0 State B Youth Confined on July 1, 2003 Total Youth Population DRI BlackWhite Total 51060 570 89%11% 100% 160,00065,000 225,000 71%29% 100% 1.30.4
State A Youth Confined on July 1, 2003 Total Youth Population DRI Rate BlackWhite Total 60200 260 23%77% 100% 20,250204,750 225,000 9%91% 100% 2.60.9 3.01.0 To calculate the “relative rate index” (or RRI), divide one rate over the other to create a ratio. State B Youth Confined on July 1, 2003 Total Youth Population DRI Rate BlackWhite Total 51060 570 89%11% 100% 160,00065,000 225,000 71%29% 100% 1.30.4 3.20.9
State A Youth Confined on July 1, 2003 Total Youth Population DRI Rate BlackWhite Total 60200 260 23%77% 100% 20,250204,750 225,000 9%91% 100% 2.60.9 3.01.0 RRI = 3.0 State B Youth Confined on July 1, 2003 Total Youth Population DRI Rate BlackWhite Total 51060 570 89%11% 100% 160,00065,000 225,000 71%29% 100% 1.30.4 3.20.9
State A Youth Confined on July 1, 2003 Total Youth Population DRI Rate BlackWhite Total 60200 260 23%77% 100% 20,250204,750 225,000 9%91% 100% 2.60.9 3.01.0 RRI = 3.0 Note the very different conclusions suggested by the DRI and the RRI State B Youth Confined on July 1, 2003 Total Youth Population DRI Rate BlackWhite Total 51060 570 89%11% 100% 160,00065,000 225,000 71%29% 100% 1.30.4 3.20.9 RRI = 3.6
Developing the RRI • Creating Rates • Examining Individual Decision Points
waived to criminal (adult) court total population • placed out of home • probation • other sanctions • dismissed/released formally adjudicated The old method (DRI) compares percentages of minority youth at each stage of the juvenile justice system to the percentage of minorities in the population as a whole petitioned arrests • placed out of home • probation • other sanctions • dismissed/released not adjudicated court referrals • placed out of home • probation • other sanctions • dismissed/released not petitioned
waived to criminal (adult) court total population • placed out of home • probation • other sanctions • dismissed/released formally adjudicated petitioned arrests • placed out of home • probation • other sanctions • dismissed/released not adjudicated court referrals • placed out of home • probation • other sanctions • dismissed/released not petitioned
waived to criminal (adult) court total population • placed out of home • probation • other sanctions • dismissed/released formally adjudicated petitioned arrests • placed out of home • probation • other sanctions • dismissed/released not adjudicated court referrals • placed out of home • probation • other sanctions • dismissed/released not petitioned
waived to criminal (adult) court total population • placed out of home • probation • other sanctions • dismissed/released formally adjudicated petitioned arrests • placed out of home • probation • other sanctions • dismissed/released not adjudicated court referrals • placed out of home • probation • other sanctions • dismissed/released not petitioned
waived to criminal (adult) court total population • placed out of home • probation • other sanctions • dismissed/released formally adjudicated The new method (RRI) compares the percentage of minority youth at each stage of the juvenile justice system to the percentage of minorities at the previous stage petitioned arrests • placed out of home • probation • other sanctions • dismissed/released not adjudicated court referrals • placed out of home • probation • other sanctions • dismissed/released not petitioned
waived to criminal (adult) court total population • placed out of home • probation • other sanctions • dismissed/released formally adjudicated petitioned arrests • placed out of home • probation • other sanctions • dismissed/released not adjudicated court referrals • placed out of home • probation • other sanctions • dismissed/released not petitioned
waived to criminal (adult) court total population • placed out of home • probation • other sanctions • dismissed/released formally adjudicated petitioned arrests • placed out of home • probation • other sanctions • dismissed/released not adjudicated court referrals • placed out of home • probation • other sanctions • dismissed/released not petitioned
waived to criminal (adult) court total population • placed out of home • probation • other sanctions • dismissed/released formally adjudicated petitioned arrests • placed out of home • probation • other sanctions • dismissed/released not adjudicated court referrals • placed out of home • probation • other sanctions • dismissed/released not petitioned
waived to criminal (adult) court total population • placed out of home • probation • other sanctions • dismissed/released formally adjudicated petitioned arrests • placed out of home • probation • other sanctions • dismissed/released not adjudicated court referrals • placed out of home • probation • other sanctions • dismissed/released not petitioned
To make these comparisons possible, two compromises are likely: • The definitions of processing stages will probably vary slightly across jurisdictions • Data will have to be for youth handled in one year (e.g., cases disposed in one year) even though they may have been arrested in different years • Thus, calculations won’t be “true rates” – Not: “the charging rate among youth referred this year”But: “number of youth charged this year divided by the number of youth referred this year”
How Should States Calculate the RRI? • The same type of data used for the DRI can be used to calculate the RRI • 1. Number of all youth… a) in the total population, and b) at various stages in the j.j. process • 2. Number of youth of specific races and ethnicities… a) in the total population, and b) at various stages in the j.j. process
This form contains real DMC data from Fresno, CA Let’s take a closer look.
The DRI requires states to calculate the proportion of various ethnic groups among the the general youth population. Then, the proportion of those youth in the committed population.