Download
1 / 64
640 likes | 734 Views
Clinical Cardiovascular Anatomy & Physiology Concepts, Definitions, & Principles. Slides developed in collaboration with Dr. John Green, 2003. The Normal Heart - Coronary Artery Anatomy. Left Main CA. Layers of the Arterial Wall. Circumflex. Adventitia. Media. Intima. Right CA.

E N D
Clinical Cardiovascular Anatomy & Physiology Concepts, Definitions, & Principles Slides developed in collaboration with Dr. John Green, 2003.
The Normal Heart - Coronary Artery Anatomy Left Main CA Layers of the Arterial Wall Circumflex Adventitia Media Intima Right CA Marginal Branch Left Anterior Descending CA
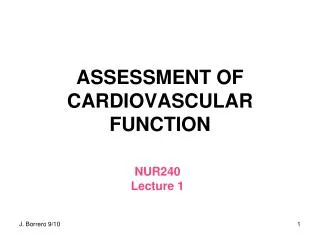
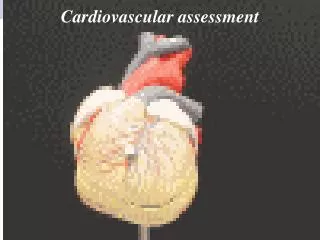
The Heart as a Pump Reference: Berne and Levy, “Physiology”
Cardiac Muscle Differences • Fibers organized into functional syncytium • branching, interconnected fibers • ends separated by intercalated disks fused to adjoining fibers by tight junctions; low resistance • all-or-none law applies to entire myocardium • Cannot be tetanized • due to phase 2 (plateau) of action potential
Left Ventricular Volumes - Definitions End Diastolic Volume (EDV) Volume at the end of diastole (end of ventricular filling) End Systolic Volume (ESV) Volume at the end of systole (end of ventricular contraction) Stroke Volume (SV) = EDV - ESV Ejection Fraction (EF) = SV EDV Ejection Fraction is the best indicator of heart performance and disease prognosis Left ventricular norm: 62%
Definitions • Cardiac Output (Q) = HR X SV • Cardiac Index = Q / body surface area • Preload: diastolic filling volume of the left ventricle (EDV reflects stretch of the cardiac muscle cells) • Afterload: resistance to ventricular emptying during systole (the amount of pressure the left ventricle must generate to squeeze blood into the aorta • Frank Starling Law of the Heart - the heart will contract with greater force when preload (EDV) is increased • Myocardial Contractility - the squeezing contractile force that the heart can develop at a given preload • regulated by: • sympathetic nerve activity (most influential) • catecholamines (epinephrine norepinephrine) • amount of contractile mass • drugs
Starlings Law of the Heart and Contractility ↑contractility SV left ventricular performance normal contractility ↓ contractility (heart failure) preload (venous return)
Using Ventricular Pressure Curves as Indices of Contractility & Cardiac Function dP/dt = change in pressure per unit of time dP/dt dP/dt Normal Heart Failure 120 Note elevation in end diastolic pressure 0
Contractility • - a change in developed tension at a given resting fiber length OR an increase in Vmax • increase max dP/dt from LV pressure curve • Positive and negative inotropic effects • Ejection fraction (EF = SV/EDV) used in clinical practice • increase contractility assumed with increase EF • with Ca, NE, digitalis, exercise; with [K]o, [Na]o
Influences on Myocardial Contractility ↑ Contractility related to : beta-sympathetic adrenergic nerves catecholamines: epinephrine norepinephrine drugs: digitalis sympathomimetics ↓ Contractility related to: loss of contractile mass - myocardial Infarction myocardial muscle disease - cardiomyopathy drugs: anesthetics, barbiturates
Definitions • Arteriovenous Oxygen Difference (AVO2D) the difference in oxygen content between arterial and venous blood • measured in ml% - ml O2 / 100 ml blood • Oxygen Consumption (VO2) - the rate at which oxygen can be used in energy production and metabolism • “absolute” measures: L / min , ml / min • “relative measures: ml / kg body wt. / min • Fick equation: VO2 = Q X AVO2D • Maximum Oxygen Consumption (VO2max) maximum rate at which a person can take in and utilize oxygen to create usable energy • defined as plateau of consumption rate increase • often estimated with VO2peak • Myocardial Oxygen ConsumptionVO2 of the heart muscle (myocardium) • "estimated" by RPP: HR X SBP • Functional Aerobic Impairment: mild 27% - 40% moderate 41% - 54% marked 55% - 68% severe > 69% predicted VO2max - attained VO2max predicted VO2max
Definitions • Systolic Blood Pressure (SBP) pressure measured in brachial artery during systole (ventricular emptying and ventricular contraction period) • Diastolic Blood Pressure (DBP) pressure measured in brachial artery during diastole (ventricular filling and ventricular relaxation) • Mean Arterial Pressure (MAP) "average" pressure throughout the cardiac cycle against the walls of the proximal systemic arteries (aorta) • estimated as: .33(SBP - DBP) + DBP • Total Peripheral Resistance (TPR) - the sum of all forces that oppose blood flow • length of vasculature (L) • blood viscosity (V) • hydrostatic pressure (P) • vessel radius (r) TPR = ( 8 ) ( V ) ( L ) () ( r 4 )
Cardiovascular Hemodynamic Basics Pressure (MAP) P aorta – P vena cava = = Resistance (TPR) (8) (V) (L) () (r 4) Flow (Q) Flow (Q) = () (Pa – Pv) (r 4) (8) (V) (L) Normally Resting Q is about 5 - 6 liters / minute V = viscosity of fluid (blood) flowing through the pipe L = length of pipe (blood vessel) r = radius of the pipe (blood vessel) Pa = aortic pressure Pv = venous pressure
Brain The Systemic Circulation Lungs Arteries (Stiff Inflexible “Pipes”) Veins (Flexible Compliant “Pipes”) Precapillary Sphincters Liver Stomach Pancreas Intestines Kidneys Arterioles Skin Muscle
Microcirculatory Anatomy Arteriole Smooth Muscle Precapillary Sphincter Anastomosis (Shunt) True Capillary With Single Layer of Endothelium Metarteriole Venule
Effects of an Increase in Preload on Left Ventricular Pressure Volume Loop ↑ Ejection Pressure 120 Left Ventricular Pressure (mmHg) ↑ SV ↑ EDV ↑ EDP 6 40 140 Volume (ml)
Effects of an Increase in Afterload on Left Ventricular Pressure Volume Loop ↑ ESV ↑ ESP 120 Left Ventricular Pressure (mmHg) ↓ SV 6 40 140 Volume (ml)
Mechanism of Control of Cardiovascular and Respiratory Systems
Sites of Cardiorespiratory Control
Cardiorespiratory Control • Stroke Volume – regulated by Frank Starling mechanism • ↑venous return→ ↑EDV →↑stroke volume • Cardiac Output (Q)– main determinant: body O2 needs • Autoregulated by intrinsic changes in preload, & SV • ↑afterload → initial ↓in Q →↑EDV →↑SV back to normal • ↑ venous return →↑preload →↑SV • Autoregulated by extrinsic hormonal influences • Norepinephrine release →↑HR and SV
Cardiorespiratory Control • Exercise Systemic Blood Flow: Autonomic influences • Sympathetic outflow & circulating catecholamines • a activation → vasoconstriction in non - exercising tissue • Approximate redistribution of blood flow during maximal exercise • NC in brain blood flow 500 ml/min ↑to heart • 11,300 ml/min ↑ to muscle 400 ml/min ↑to skin • 500 ml/min ↓to kidneys 800 ml/min ↓ to viscera • 200 ml/min ↓to various other parts of the body Rest Max Exercise
Acute Responses to Aerobic Exercise • Heart Rate • ↑up to 3 times resting value at peak exercise (↓time spent in diastole) • Oxygen Consumption (VO2) • Expressed in both relative and absolute terms • Relative: ml O2/kg/min Absolute: ml/min or L/min • average VO2max for 40 year old male 37 ml/kg/min • Resting metabolic equivalent = 1 MET = 3.5 ml/kg/min • Oxygen consumption linked to caloric expenditure (1 liter of O2 consumed = 5 kcal) 180 160 140 100 Heart Rate • HR – VO2 relationship is linear until about 90% VO2max 1.0 2.0 3.0 Oxygen Uptake (L / min) 50 150 250 Workloads (Watts)
Cardiac Output (Q) • ↑up to 4 times resting value at peak exercise (↑is rapid at onset, then levels off) • ↑Q →↑venous return • Venous return mediated by and related to: • sympathetic venoconstriction • muscle pump • ↑inspiration →↓ thoracic pressure • blood flows to an area of reduced pressure • ↑inspiration →↑ abdominal pressure • contraction of abdominal muscles • squeezing of abdominal veins • Stroke Volume • ↑up to 1.5 resting value at peak exercise • increase levels off at 40% - 50% VO2 max • ↑ in venous return → ↑EDV (Starling mechanism) • ↓ESV eluding to an ↑ in myocardial contractility • ↑ejection fraction: rest: 58% max exercise: 83% Acute Responses to Aerobic Exercise 120 110 70 Stroke Volume (ml/beat 25% 50% 75% Percentage of VO2 max
Arteriovenous oxygen difference • Difference in [O2] between arterial and mixed venous blood • Illustrated by the oxyhemoglobin desaturation curve • ↑approximately 3 fold from rest to max exercise • at rest, about 25% of arterial O2 is extracted • at peak exercise 85% of arterial O2 is extracted • Blood Pressures and Resistance to Flow • SBP: ↑- failure to ↑signifies heart failure • DBP: slight ↑or slight ↓ or NC • MAP: slight ↑ • TPR: ↓- mainly due to vasodilation in exercising muscle • Coronary (Myocardial) Blood Flow • 4.5% of Q goes to myocardium at rest and at peak exercise • this increase is due to ↑MAP and CA vasodilation • Blood Flow to the Skin • ↑as exercise duration ↑ to allow for heat dissipation • ↓at max exercise to meet exercising muscle demands • ↑during exercise recovery, again for heat dissipation Acute Responses to Aerobic Exercise
Acute Responses to Aerobic Exercise • Minute Ventilation • resting average: 6 Liters/min • peak exercise average: 175 Liters/min • respiratory rate: resting 12-18 peak exercise: 45-60 • tidal volume: resting .5 liters peak exercise: 2.25 Liters • Plasma Volume • blood plasma ↑ in the interstitum of exercising muscle • fluid shift results in a 5% ↑ in the hemoconcentration • blood viscosity increases
Oxygen Debt and Deficit Oxygen DEBT & Oxygen DEFICIT Oxygen Deficit Oxygen Debt (EPEOC) “Steady State” VO2 VO2 Untrained or people with certain cardiorespiratory diseases will have larger DEBTS and DEFICITS Rest EXERCISE TIME Onset Termination • Oxygen Deficit due to: • delay in time for aerobic ATP production to supply energy • Oxygen Debt due to: • resynthesis of high energy phosphates (CP, ATP) • replace oxygen stores • lactate conversion to glucose (gluconeogenesis) • ↑ HR, respiration, catecholamines, body temperature
OBLA Respiratory Compensation (hyperventilation) No Change in VE VCO2 Ventilatory and Metabolic Changes During Exercise Increasing workload
Resting NC ↓ NC VO2= HR x SV x AVO2diff due to: due to: ↑ time in diastole ↑ preload ↓ afterload ↑ ventricle size ↑ blood volume Submax Workload (measured at same pre-training workload) NC NC VO2= HR x SV x AVO2diff note:a ↓ in afterload (mentioned above) accompanied by a ↓ in HR response translates into a ↓ myocardial VO2 at rest or at any workload Max Workload (measured at peak exercise) NC VO2= HR x SV x AVO2diff some studies show a slight decrease ↑ ↑ Effects of Exercise Training on the Components of the Fick Relationship
Mean Arterial Pressure • NC at rest or during exercise • Systolic and Diastolic Blood Pressure • usually NC at rest or during exercise • possible ↓ at submaximal workload • may ↓ at rest in borderline hypertensives • some studies report a mean ↓ of about 9 mmHg • Total Peripheral Resistance and Afterload • ↑ capillarization (more parallel circuits) → ↓ TPR • ↓ TPR → ↓ Afterload (slight – not of major significance) • Respiratory Variables • Respiratory Rate • Rest: NC • Submax exercise: d • Max exercise: slight ↑ • Tidal Volume • Rest: NC • Submax exercise: NC or slight ↑ • Max exercise: slight ↑ • Anaerobic Threshold • Occurs at a higher percentage of VO2 max • Pre-training: 50% VO2max Post-training: 80% VO2max Training Adaptations
Mitochondria • ↑ number, size and membrane surface area • Aerobic Enzymes in Exercising Muscle • ↑ Krebs cycle enzymes (succinate dehydrogenase) • ↑ boxidation enzymes (carnitine acyltransferase) • ↑ electron transport enzymes (cytochrome oxidase) • Fatty Acid & Glycogen Utilization • ↑ utilization ofb oxidative pathways to produce ATP • Called the “glycogen sparring” effect • ↓ RER for any given submaximal workload • ↑ muscle glycogen stores (with high carbohydrate diet) • ↓ Platelet Aggregation • ↑ Fibrinolytic Activity • ↓ Circulating Catecholamines • ↑ vagal tone → ↓ risk of arrhythmia • No Appreciable Change in Resting Metabolic Rate • Exception: training induced ↑ in lean muscle mass • Resistance to Pathological Events • smallerinfarct size and quicker recovery • Less of a ↓ →in ventricular function during ischemia Training Adaptations
"Average" Values for Sedentary and Trained Individuals Heart Rate ( beats / minute )
"Average" Values for Sedentary and Trained Individuals Stroke Volume ( ml / beat )
"Average" Values for Sedentary and Trained Individuals Cardiac Output ( liters / minute)
"Average" Values for Sedentary and Trained Individuals A-V O2 Difference ( ml%)
"Average" Values for Sedentary and Trained Individuals Oxygen Consumption ( liters / minute)