Download

1 / 30
310 likes | 465 Views
What we are going to look at. Review the 2 models we looked at last time and add another one for good measure Look at some analysis of different towns to see if any of the models approach the towns Think about the kind of issues we need to consider when thinking about environmental quality

E N D
What we are going to look at • Review the 2 models we looked at last time and add another one for good measure • Look at some analysis of different towns to see if any of the models approach the towns • Think about the kind of issues we need to consider when thinking about environmental quality • Think about your local towns and see if the environmental quality does vary from place to place
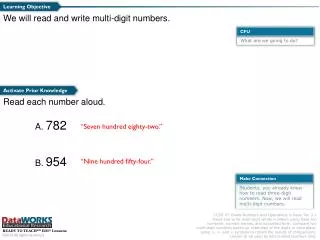
Burgess Model A – CBD B - Zone of transition – used to be where industry was, but is often now left abandoned or as a redevelopment site C – Residential – lower class D - Residential – middle class E – Residential – upper class • At its core is the CBD, or Central Business District. This is the area with the highest land price, which could only be afforded by businesses. • Around this is the zone of transition, which is where industry located. In many cities in the UK, such as Birmingham, this zone can be quite easily identified. However in most cases the industry has moved out, leaving the zone empty and in need of renewal. • Beyond the zone of transition are the rings of residential housing. As people became more wealthy they could afford to live further out of town, in bigger houses, with larger gardens. • The houses closest to the centre originally would have housed the workers for the inner city industries. Many British cities still have many of these terraced houses remaining. • As people moved away from the CBD, the houses closest to the centre would be taken by newly arrived immigrants to the city, either from elsewhere in the country or abroad.
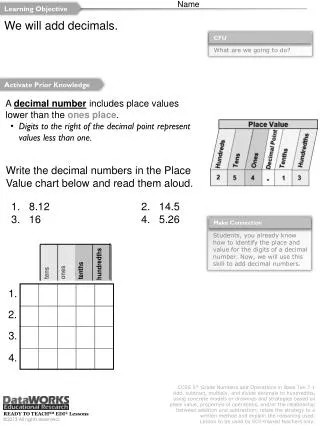
Hoyt A – CBD B - Zone of transition – used to be where industry was, but is often now left abandoned or as a redevelopment site C – Residential – lower class D - Residential – middle class E – Residential – upper class F - Industrial • The sector model has a similar idea of a CBD to Burgess. This is still the area with the highest land price. • Hoyt then used transport routes to determine where his other sectors would be located. He still had a zone of transition around the CBD, but he also had industry fanning out from the centre along major transport routes. He assumed that "Like would attract like", which is why he decided that land-uses would concentrate to form sectors, rather being in rings, like Burgess thought. • The lowest class housing would be closest to the industry, and probably be located where the prevailing winds would blow the pollution towards them (and away from the higher class housing). • The high class housing also is in a sector of its own, running all the way from the CBD, where many of the residents would work, to the outer suburbs.
Harris & Ullman's multiple nuclei model: • This model was aimed at being more specific than the other two, however it also has become more complicated. • Harris and Ullman still have a central CBD, but they also have other smaller centres performing specific functions that Hoyt and Burgess decided would have been found in and around the CBD. Thus Harris and Ullman also have a business centre, and industrial parks. • Large cities do display some of these characteristics. London has different areas of its centre that have different functions: the City, Westminster, Oxford Street and the West End all have differing specific functions. • London has also grown to engulf other towns and villages, which have become smaller CBD's within the whole of Greater London. These CBD's act as growth poles, meaning that the city does not just grow from one central point, but from many spread around its area
Urban zoning • Another way to get a more accurate feel for looking at the kind of land use is to carry out a transect. But this takes a really long time if you record every building. However, you could use a sampling method to reduce the work! More in a minute.
So what is taking an urban transect? • Choose a path through an urban area that represents the kind of land use variation within the town – so do not choose to go along a duel carriageway or wander through exclusively narrow lanes. • To trace the land use, you would probably start at the centre of the CBD
So which would be my most representative? CBD, Middle and upper and industry Missing? CBD, Lower and upper Missing? CBD, Lower Missing? What about this one? The Clock Tower
This is one tenth of a transect done in Wakefield Having chosen your route … • To do a full one you record every single building along the route. But even along this little tiny route, you are taking quite a while! • So what could you do instead? • Systematic sampling – record – gap a fixed distance - record again. You should measure the distance, but a reasonable compromise is to take so many paces – say 10 or 20 and then record again
What preparations do you need to make? • The first preparation is to make sure your route is representative. • The second is to make a big copy of the route, with the side roads named on it (that way you have a better chance of recording you results in more or less the right place). • The third thing to do is make a copy of your copy to use for the neat version when you return home! • Now you need to work out a key – do you need more that the 5 categories we have discussed so far?
RICE POTS • Stands for: • Residential • Industrial • Commercial • Entertainment • Public Buildings • Open Spaces • Transport • Services
The only fault I have with this is ‘residential’ as one group • … perhaps divide it into: • Flats, terraces, semidetached and detached?
But there is another area of study • This is about environmental quality. • Now think about the town/city that you used for homework. • Think of the nicest part of town in terms of the impression of the environment – don’t count parks or recreational areas – think places where there are buildings • Where is it? • Remember you have 5 senses – using as many as you can, what is good about this particular place?
A few hints • Smell? • Sound? • Visual – what do the buildings look like? How well maintained are they? • What about the street? The pavements? • What else can you see that makes you feel this a good place?
OK – now think of the place with worst environment • Think what was good about the previous place – how is this one bad – as many senses as possible, remember? • Now how are we going to record the information?
Now this is one such table – with the layout The name for this general method is bi-polar survey
-2 -1 0 1 2 Sometimes examiners use examples like this – what have I changed?
I personally would not go for as many as 10 categories – gets a bit too complicated! • But you do want to cover a range – smells, noise, sense of space, visuals, sense of safety,
This is one way to collect data on environmental quality • Data in geography is not exclusively numbers. Data is any evidence that shows information about the question you are investigating. • Annotated photos or drawings are a good source
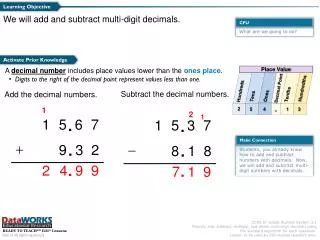
An annotated photo You may label things you saw but are not visible from the photo Street parking on narrow road Narrow pavement Tables and notices block pavement No litter – litter bin present Rough uneven pavement
What do you do with the information when you have it? • The record sheet: • The information needs to be interpreted – to do this you usually need graphs! • Bar charts – single, clustered, stacked There are a few more graphs – come back to that in a minute What could we use each of these for?
Now we need to think about a question • Going back to our nasty/nice places – where were they in your town? • Nice ones first? Where are they? • Do they tend to be in one part of the town or all over? • What about the less pleasant ones? Where are they? • Do they tend to be in one part of the town or all over? • Can you come up with a hypothesis? This is the statement of an idea • The places with high environmental scores tend to ……..
Now one such thought that works in some places is ….. • The places with high environmental scores tend to …….. • Be further from the CBD. • How would show whether this true or not? • Measure (either as the crow flies or with an odometer (distance measure in a car) or pedometer (meter that measures how far you have walked). • Then plot a scatter diagram with distance along the horizontal axis and score on the vertical axis, like this …..
From the graph, it can be seen that as the distance increases, so does the environmental quality score. This means that the further the site is from the CBD, the better the environmental quality is.
There is no one right way to do these. In Rhayader for example there is very little litter anywhere – the street bins are emptied every week and the roads are swept often Homework • Design an environmental survey. • Then check out that it works like this: • Go to a place that you feel has good environmental quality. Fill in the survey sheet – add up the score – is it a high score? Does it really represent the fact that this place is really nice? • Take at least one photo in each place to practice annotation • Repeat with a place where you feel the environmental quality is not so good – ask the same questions. • At this point you may want to alter some of your pairs, so that it better reflects the good/bad points of each place.
The write up • The write up • These are the bi-polar pairs I put in my trial survey: • Noisy- quiet • Etc • I trailed the survey in 2 places. • X was a place that I felt had a good environment because….It received a score of __ out of a maximum ___. (Did you feel this covered all the good points? Was there anything else you could have given a score to that would have given a clearer picture?) • Y was a place that I felt had a poor environment because …. It got ___ out of ___. (Did you feel this covered all the bad points? Was there anything else you could have given a score to that would have given a clearer picture?) • So I changed/did not change any of the pairs from …. to … • [And if you did change anything, show the new scores] • Add the annotated photos/sketches to your report.
Extension • You may like to add a stacked % bar chart of the different items to compare and follow this with a brief summary of what make X so good and Y so bad.