Download
1 / 28
300 likes | 443 Views
Expected values, covariance, correlation. Introduction to Bivariate Regression . Is the perception that the majority of Russians believe the same way you do related to how often you discuss politics with friends?. Is this a causal relationship?. Majority of Russians believe the same.

E N D
Expected values, covariance, correlation Introduction to Bivariate Regression
Is the perception that the majority of Russians believe the same way you do related to how often you discuss politics with friends?
Is this a causal relationship? Majority of Russians believe the same Discussions of politics with friends Discussions of politics with friends Majority of Russians believe the same
When it comes to politics, how close do you think your opinions are to the opinions of the majority of Russians? very close, rather close, not very close, not close at all freq vars = majrcl / stats = mean stddev var.
How often do you do the following discuss political questions with friends, neighbors, or coworkers almost never, a few times a year, a few times a month, a few times a week, or practically every day? freq vars = discfrnd / stats = mean stddev var.
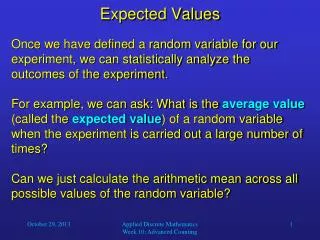
Expected value v. probability • If our population set of numbers is: 1,1,3,3,17, then the expected value is 5, even though P(5) = 0. • Suppose we know that E(X) = 5 with the equation y = 5 + 7x. • What is E(Y)?
Expected values What is the expected value of majrcl? What is the range? Mode? Why are there 63 missing? What is the expected value of discfrnd? Why is the standard deviation and variance so high?
Variables, means, variances and standard deviations of a small sample majrcl discfrnd 2.00 4.00 2.00 3.00 . 4.00 . 1.00 2.00 1.00 3.00 4.00 3.00 3.00 3.00 3.00 . 3.00 2.00 2.00 . 3.00 3.00 3.00 3.00 4.00 3.00 5.00 3.00 1.00 3.00 3.00
Review standard deviation and variance • Variance: for each unit or observation, it is the distance from the mean squared and then divide by the number of units • Standard deviation – square root of variance • since variance is in squared units, it doesn’t make any sense. The standard deviation can be understood in terms of the original measurement unit
Excel table example 1: calculating variance and standard deviations
Central limit theorem You have a single predicted value, and then, when you predict, you have error from the real value from the predicted value. This is based on the statistical theory of reproducibility. You use the variance to estimate the error. In predicting error from sample to population, with which variable can we be more accurate?
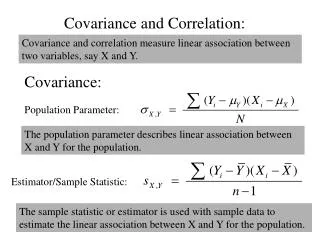
Causation • Time ordering • Covariation • What is co-variation? • What is variation? • average distance between the mean of x and each x value, squared: • (xi - xmean)^2/n • aka (xi - xmean) (xi - xmean)/n
Covariation? (xi - xmean) * (yi - ymean) / n-1
Covariation • covariance can take any value • negative infinity to positive infinity
Intuitive explanation of positive covariation Sum of (xi - xmean) * (yi - ymean) / n-1 • When x and y are high at the same time and x and y are low at the same time, then the covariance is positive • When they are both higher than their means, the numbers being multiplied are positive • When they are both lower than their means, then the numbers being multiplied are both negative, which results in a positive number • A bunch of positive numbers being added to a bunch of other positive numbers results in a high positive number
Intuitive explanation of negative covariation Sum of (xi - xmean) * (yi - ymean) / n-1 • When x is low when y is high and vice versa, then the covariance is negative • When one is higher than the mean and the other is lower than the mean, then this results in a negative number • A bunch of negative numbers added together results in a high negative number
Intuitive explanation Sum of (xi - xmean) * (yi - ymean) / n • When sometimes: • x and y are high at the same time and x and y are low at the same time • And about half of the other time • x is low when y is high and vice versa • Then the covariance is about 0 • A bunch of positive numbers are added to a bunch of negative numbers
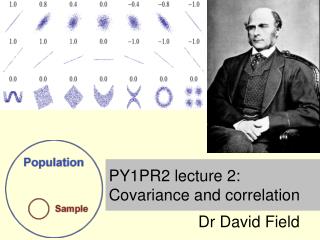
Plot showing positive covariance Mean urban % Mean female literacy
Plot showing negative covariance Mean calorie intake Mean infant mortality
Plot showing no covariance Mean GDP Mean crop production
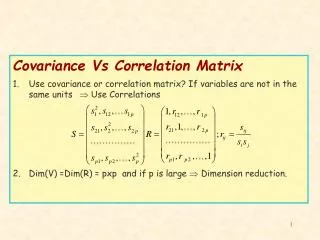
Covariance is a function of… • Variance (standard deviation) of x • Variance (standard deviation) of y • Relationship between x and y
How can you compare a covariance of 132 and 134,847? • 134, 847 could be high variance of x, high variance of y, high variance of both variables, or a high relationship between x and y? • Not that helpful?
How can you change the covariance to a number that tells you only the magnitude of the relationship between x and y? • Divide by the standard deviation of x * the standard deviation of y • Correlation = (x-xmean)*(y-ymean) /Sd(x) * sd (y) • Note that the n-1 in each cancel one another out • Note the similarity with a zscore.
Covariance is a function of • Variance of x • Variance of y • Relationship between x and y
Covariance and correlation compared • Covariance is never reported • Correlation is in standardized units (units of standard deviations) • Cannot compare standardized units across variables or samples because the standard deviations vary • Covariance ranges from negative to positive infinity • Correlation ranges from -1 to 1 • The most common correlation is Pearson r. when variables are not continuous, there are other, closely related correlation coefficients.