Download
1 / 44
440 likes | 582 Views
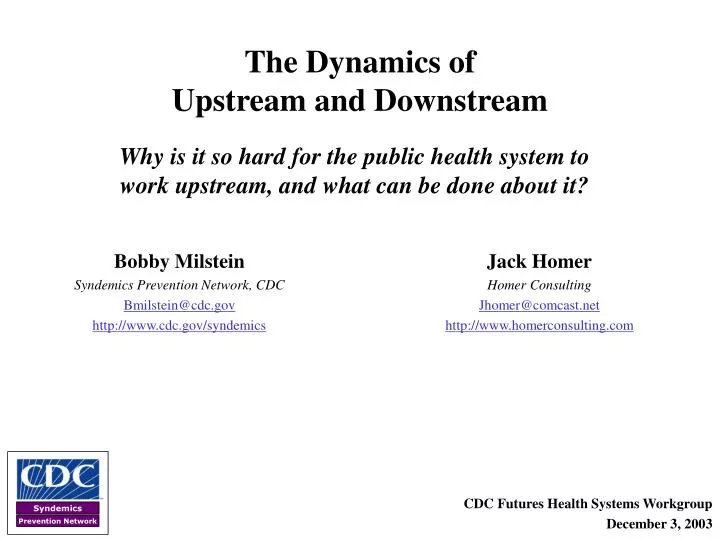
The Dynamics of Upstream and Downstream. Why is it so hard for the public health system to work upstream, and what can be done about it?. Bobby Milstein Syndemics Prevention Network, CDC Bmilstein@cdc.gov http://www.cdc.gov/syndemics. Jack Homer Homer Consulting Jhomer@comcast.net

E N D
The Dynamics of Upstream and Downstream Why is it so hard for the public health system to work upstream, and what can be done about it? Bobby Milstein Syndemics Prevention Network, CDC Bmilstein@cdc.gov http://www.cdc.gov/syndemics Jack Homer Homer Consulting Jhomer@comcast.net http://www.homerconsulting.com CDC Futures Health Systems Workgroup December 3, 2003
Public Health Effort Across the Chain Upstream Prevention and Protection ----------------------------------- Total 3% Downstream Care and Management -------------------------------- Total 97%
Becoming no longer vulnerable Safer, Healthier Population Vulnerable Population Becoming Afflicted Becoming Afflicted with Afflicted vulnerable without Complications Complications Developing Complications Dying from Complications The Simple Physics of Upstream and Downstream
Focusing on disease prevention and control has led to major achievements Actual and Expected Death Rates for Coronary Heart Disease, 1950–1998 700 Rate if trend continued 600 500 Peak Rate 400 Age-adjusted Death Rate per 100,000 Population 300 200 Actual Rate 100 50 1950 1955 1960 1965 1970 1975 1980 1985 1990 1995 Year Marks JS. The burden of chronic disease and the future of public health. CDC Information Sharing Meeting. Atlanta, GA: National Center for Chronic Disease Prevention and Health Promotion; 2003.
But the pictures look different when we examine people’s overall state of health or affliction 14% increase Source: Centers for Disease Control and Prevention. Health-related quality of life: prevalence data. National Center for Chronic Disease Prevention and Health Promotion, 2003. Accessed March 21 at <http://apps.nccd.cdc.gov/HRQOL/>.
Why Do We Do Public Health Work?What is the System Organized to Do? CDC Vision & Mission Healthy people, in a healthy world, through prevention To promote health and quality of life by preventing and controlling disease, injury, and disability Institute of Medicine The purpose of public health is to fulfill society’s interest in assuring the conditions in which people can be healthy How we reconcile these two frames of reference will shape the possibilities for what we can accomplish in leading health system change.A systems approach understands that both perspectives exist in a dynamic relationship with each other.
Why Has it Been So Hardto Correct the Imbalance? “When we attribute behavior to people rather than system structure the focus of management becomes scapegoating and blame rather than the design of organizations in which ordinary people can achieve extraordinary results.” -- John Sterman Sterman J. System dynamics modeling: tools for learning in a complex world. California Management Review 2001;43(4):8-25.
Society's Health Response General Targeted Primary Secondary Tertiary protection protection prevention prevention prevention Becoming no longer vulnerable Afflicted Afflicted with Safer, Vulnerable without Complications Healthier Population Developing Complications Becoming Becoming Population Complications Vulnerable Afflicted Dying from Complications Adverse Living Conditions Public Work (organizing, governance, citizenship, mutual accountability) Professional Work (customers, products, services) What Kinds of Work Must the Public Health System Perform? more inter-organizationally complex, slower rate of improvement organizationally complex, faster rate of improvement FOR SELF INTEREST FOR OTHERS IN NEED
“Let me assure you, we will survive any crisis that involves funding, political support, popularity, or cyclic trends, but we can't survive the internal crisis, if we become provincial, focus totally on the short term, or if we lose our philosophy of social justice.” -- Bill Foege Foege WH. Public health: moving from debt to legacy. American Journal of Public Health 1987;77(10):1276-8.
Beyond the Obvious Morality of it, Why Place So Much Emphasis on Social Justice?
Becoming no longer vulnerable Safer, Healthier Population Vulnerable Population Becoming Afflicted Becoming Afflicted with Afflicted vulnerable without Complications Complications Developing Complications Dying from Complications What Drives Change Across the Chain?
Upstream and Downstream Work Downstream lock-in: Delay in upstream effort guarantees continued growth in affliction, need for downstream effort and, hence, dependency on professionals, which further undermines upstream effort, as does mounting social disparity.
Dynamic Models Let Us Search for Policies That Leverage Public Work • Computer technology makes it feasible to put system maps in motion, to learn how health patterns change under different conditions, and to seriously evaluate or rehearse the long-term effects of response options: they provide added foresight • Such models open new avenues for domestic and global problem solving, systems research, knowledge integration, game-based learning, as well as richer dialogue among stakeholders Prototype of a health system simulation model
CDC’s Strength Lies in Leading Public Work • CDC’s credibility and effectiveness rest on more than scientific excellence • The agency’s reputation also stems from the widespread perception that CDC is an organization of talented people working to protect us all: a people’s institution • If CDC comes to be viewed primarily as a provider of products/services to customers in need, it could erode leadership potential for upstream action
SummaryWhy is it So Hard to Work Across the Whole System? Initial Observations • Upstream work requires more public concern, which is less a reaction to the prevalence of disease as to the spread of vulnerability and affliction that over many years threaten everybody (think of economic decline, inadequate education, unsafe housing, sprawl, racism, environmental decay, etc.) • Long before upstream threats become widely apparent, money and other resources have focused downstream (where professional expertise and the weight of scientific evidence lie) • Because of their role as providers of downstream services, health professionals do not respond to vulnerability and social disparity FOR ITS OWN SAKE, in the WAY that ordinary citizens often do • Upstream health action involves broad-based organizing; it is political—but non-partisan—and cannot be done by professionals alone.
"The people's health...is a concern of the people themselves. They must want health. They must struggle for it and plan for it. Physicians are merely experts whose advice is sought in drawing up plans and whose cooperation is needed in carrying them out. No plan, however well devised and well intentioned, will succeed if it is imposed on the people. The war against disease and for health cannot be fought by physicians alone. It is a people's war in which the entire population must be mobilized permanently." Sigerist, HE. Health.Journal of Public Health Policy., 1996 17(2): 204-234.
Steps For Putting the Map in Motion • Start with an explicit dynamic hypothesis (i.e., what causal forces are at work?) • Convert that hypothesis into a formal computer model (i.e., by writing a system of differential equations; and calibrating it based on all available data; areas of uncertainty are noted and become the focus for sensitivity analysis) • Use the computer model to conduct controlled simulation studies, with the goal of learning how the system behaves and how to govern its evolution over time • Iteratively repeat the process, creating better hypotheses, better models, and better policy insight
B General Protection Targeted protection effect on vulnerability Public health reduction response General protection effect on vulnerability onset B Targeted Protection Complicated B afflicted percent of popn Treatment Vulnerability reduction Tertiary prevention Afflicted Afflicted with effect on Vulnerable General without - Complications complications Population Population Affliction Complications Affliction Vulnerability progression incidence onset - Death from - - Complications B Secondary Prevention Secondary prevention effect on progression B Primary Prevention Primary prevention effect on incidence Building a Dynamic Hypothesis Note: for this initial model, the system being modeled includes only a subset of the dynamics that were identified in the conceptual map.
Could the behavior of this system be modeled using conventional epidemoiological methods (e.g., logistic or multi-level regression)?
Writing Differential Equations Active Equations (01) Afflicted = Afflicted without Complications + Afflicted with Complications (02) Afflicted with Complications = INTEG( Affliction progression - Death from Complications , 0) (03) Afflicted without Complications = INTEG( Affliction incidence - Affliction progression , 0) (04) Affliction incidence = Vulnerable Popn * Affliction incidence rate baseline * Primary prevention effect on incidence (05) Affliction incidence rate baseline = 0.05 (06) Affliction progression = Afflicted without Complications * Affliction progression rate baseline * Secondary prevention effect on progression (07) Affliction progression rate baseline = 0.1 (08) Complicated afflicted percent of popn = 100 * Afflicted with Complications / Total popn (09) Complicated afflicted percent required to elicit maximum PH response = 20 (10) Complicated percent of afflicted = 100 * ZIDZ ( Afflicted with Complications , Afflicted ) (11) Complications death rate baseline = 0.1
Writing Differential Equations (12) Death from Complications = Afflicted with Complications * Complications death rate baseline * Tertiary prevention effect on complications (13) General Popn = INTEG( Net increase in genl popn + Vulnerability reduction - Vulnerability onset , Total popn initial * ( 100 - Vulnerable percent initial ) / 100) (14) General protection effect from max PHR = 0.5 (15) General protection effect on vulnerability onset = 1 - ( 1 - General protection effect from max PHR ) * Public health response / 100 (16) Net increase in genl popn = Death from Complications * ( 1 - Vulnerable percent of nonafflicted / 100) (17) Net increase in vulnerable popn = Death from Complications * Vulnerable percent of nonafflicted / 100 (18) Nonafflicted = General Popn + Vulnerable Popn (19) Primary prevention effect from max PHR = 0.5 (20) Primary prevention effect on incidence = 1 - ( 1 - Primary prevention effect from max PHR ) * Public health response / 100 (21) Public health response = DELAY1I ( 100 * MIN ( 1, Complicated afflicted percent of popn / Complicated afflicted percent required to elicit maximum PH response ) , Time for public health to respond to affliction prevalence , 0)
Writing Differential Equations (22) Secondary prevention effect from max PHR = 0.5 (23) Secondary prevention effect on progression = 1 - ( 1 - Secondary prevention effect from max PHR ) * Public health response / 100 (24) Targeted protection effect from max PHR = 2 (25) Targeted protection effect on vulnerability reduction = 1 + ( Targeted protection effect from max PHR - 1) * Public health response / 100 (26) Tertiary prevention effect from max PHR = 0.5 (27) Tertiary prevention effect on complications = 1 - ( 1 - Tertiary prevention effect from max PHR ) * Public health response / 100 (28) Time for public health to respond to affliction prevalence = 2 (29) Total popn = Nonafflicted + Afflicted (30) Total popn initial = 100000 (31) Vulnerability onset = General Popn * Vulnerability onset rate baseline * General protection effect on vulnerability onset (32) Vulnerability onset rate baseline = 0.05
Writing Differential Equations (33) Vulnerability reduction = Vulnerable Popn * Vulnerability reduction rate baseline * Targeted protection effect on vulnerability reduction (34) Vulnerability reduction rate baseline = 0.07 (35) Vulnerable percent initial = 10 (36) Vulnerable percent of nonafflicted = 100 * Vulnerable Popn / Nonafflicted (37) Vulnerable Popn = INTEG( Net increase in vulnerable popn + Vulnerability onset - Affliction incidence - Vulnerability reduction , Total popn initial * Vulnerable percent initial / 100)