Download
1 / 6
60 likes | 131 Views
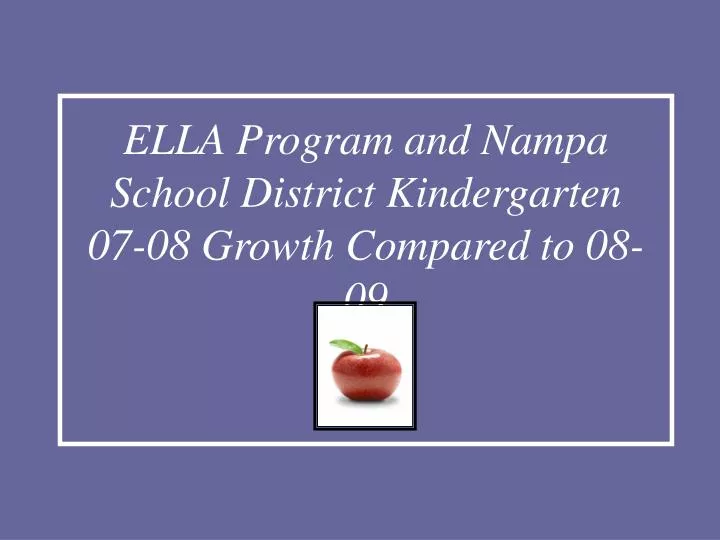
ELLA Program and Nampa School District Kindergarten 07-08 Growth Compared to 08-09. 100.00%. 90.00%. 80.00%. 70.00%. 60.00%. Fall 07. 47%. 48%. 50.00%. Fall 08. 40.00%. 27%. 28%. 30.00%. 24%. 25%. 20.00%. 10.00%. 0.00%. % of Intensive. % of Strategic. % of Benchmark.

E N D
ELLA Program and Nampa School District Kindergarten 07-08 Growth Compared to 08-09
100.00% 90.00% 80.00% 70.00% 60.00% Fall 07 47% 48% 50.00% Fall 08 40.00% 27% 28% 30.00% 24% 25% 20.00% 10.00% 0.00% % of Intensive % of Strategic % of Benchmark Nampa Kindergarten Fall 07 IRI Compared to 08 IRI
100.00% 90.00% 80% 80.00% 67% 70.00% 60.00% IRI 08 50.00% IRI 09 40.00% 30.00% 24% 12% 12% 20.00% 9% 8% ? 10.00% 0.00% % of Intensive % of Strategic % of Benchmark Nampa Spring 08 IRI Compared to Spring 09 IRI: 13% More Students Scored at Grade Level
Combined View of Nampa’s Growth Compared to the State Nampa was 8% behind State % on Grade Level
Nampa Closed an 8% Gap When Compared to the State During the Fall IRI - to only 2% Gap on the Spring IRI