Download
1 / 37
770 likes | 1.98k Views
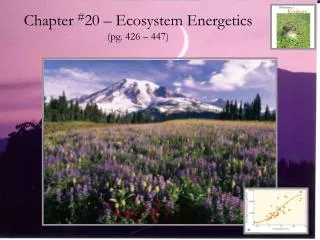
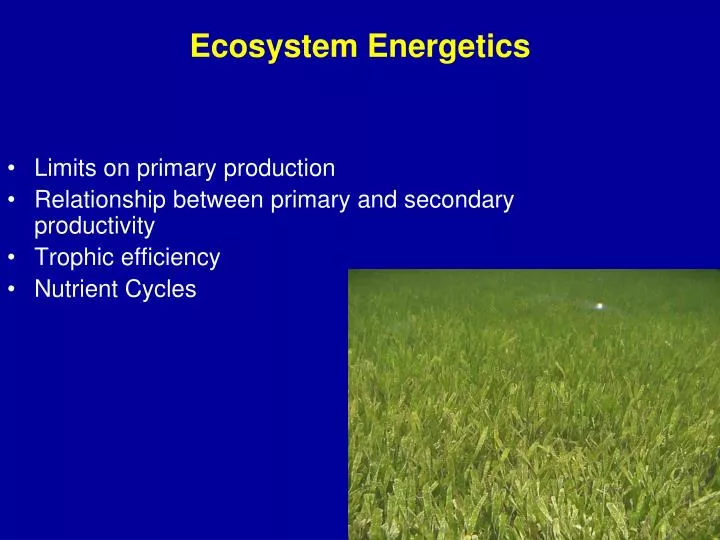
Ecosystem Energetics. Limits on primary production Relationship between primary and secondary productivity Trophic efficiency Nutrient Cycles. Energy flow in ecosystems. Ecosystem energetics - terminology.

E N D
Ecosystem Energetics • Limits on primary production • Relationship between primary and secondary productivity • Trophic efficiency • Nutrient Cycles
Ecosystem energetics - terminology • Standing crop (=biomass) – amount of accumulated organic matter found in an area at a given time [g/m2] • Productivity – rate at which organic matter is created by photosynthesis [g/m2/yr] • Primary productivity – autotrophs • Secondary - heterotrophs • Gross versus net primary productivity
Ecological Efficiency • Ecological efficiency (food chain efficiency) is the percentage of energy transferred from one trophic level to the next: • range of 5% to 20% is typical, mean = 10% • to understand this more fully, we must study the utilization of energy within a trophic level
Intratrophic Energy Transfers • Intratrophic transfers involve several components: • ingestion (energy content of food ingested) • egestion (energy content of indigestible materials regurgitated or defecated) • assimilation(energy content of food digested and absorbed) • excretion (energy content of organic wastes) • respiration (energy consumed for maintenance) • production(residual energy content for growth and reproduction)
Fundamental Energy Relationships • Components of an animal’s energy budget are related by: 1) ingested - egested energy = assimilated energy 2) assimilated energy - respiration - excretion = production
Assimilation Efficiency • Assimilation efficiency = assimilation/ingestion • primarily a function of food quality: • seeds: 80% • young vegetation: 60-70% • plant foods of grazers, browsers: 30-40% • decaying wood: 15% • animal foods: 60-90%
Net Production Efficiency • Net production efficiency = production/assimilation • depends largely on metabolic activity: • birds: <1% • small mammals: <6% • sedentary, cold-blooded animals: as much as 75%
Production Efficiency in Plants • The concept of production efficiency is somewhat different for plants because plants do not digest and assimilate food: • net production efficiency = net production/gross production, varies between 30% and 85% • rapidly growing plants in temperate zone have net production efficiencies of 75-85%; their counterparts in the tropics are 40-60% efficient NPP= GPP - R Net Primary Gross Primary Respiration Productivity Productivity
Secondary production by trophic level n Amt respired by trophic level n Production efficiency = 14/70 Amt egested as feces (waste) by trophic level n Amt assimilated (i.e. absorbed into body) by trophic level n Assimilation efficiency 70/200 Amt ingested by trophic level n Consumption efficiency = 200/1000 Amt produced by trophic level n-1 Efficiency of energy transfer
Detritus Food Chains • Ecosystems support two parallel food chains: • herbivore-based (relatively large animals feed on leaves, fruits, seeds) • detritus-based (microorganisms and small animals consume dead remains of plants and indigestible excreta of herbivores) • herbivores consume: • 1.5-2.5% of net primary production in temperate forests • 12% in old-field habitats • 60-99% in plankton communities
Exploitation Efficiency • When production and consumption are not balanced, energy may accumulate in the ecosystem (as organic sediments). • Exploitation efficiency = ingestion by one trophic level/production of the trophic level below it. • To the extent that exploitation efficiency is <100%, ecological efficiency = exploitation efficiency x gross production efficiency.
Energy moves through ecosystems at different rates. • Other indices address how rapidly energy cycles through an ecosystem: • residence time measures the average time a packet of energy resides in storage: • residence time (yr) = energy stored in biomass/net productivity • biomass accumulation ratio is a similar index based on biomass rather than energy: • biomass accumulation ratio (yr) = biomass/rate of biomass production
Biomass Accumulation Ratios • Biomass accumulation ratios become larger as amount of stored energy increases: • humid tropical forests have net production of 1.8 kg/m2/yr and biomass of 43 kg/m2, yielding biomass accumulation ratio of 23yr • ratios for forested terrestrial communities are typically >20 yr • ratios for planktonic aquatic ecosystems are <20 days
Ecosystem Energetics • Comparative studies of ecosystem energetics now exist for various systems. • Many systems are supported mainly by autochthonous materials (produced within system). • Some ecosystems are subsidized by input of allochthonousmaterials (produced outside system).
Autochthonous versus Allochthonous Production • In streams assimilation of energy by herbivores often exceeds net primary production - difference represents energy subsidy. • autochthonous production dominates in large rivers, lakes, marine ecosystems • allochthonous production dominates in small streams, springs, and caves (100%)
Consumption efficiency determines pathways of energy flow through ecosystem
Note: • Detrital food chain accounts for most biomass produced in a community • Grazing plays greatest role in phytoplankton-based food chains
General Rules for Energy Flow through Ecosystems 1) Assimilation efficiency increases at higher trophic levels 2) Ecological efficiencies average about 10% Thus, only about 1% of NPP ends up as production in the third trophic level
Decomposition and Mineralization • Most material is derived from plants • Involves: • Release of chemical energy • Mineralization (= organic --> inorganic) • Note immobilization = reverse of mineralization • Net mineralization rate = mineralization - immobilization
Terrestrial communities:Nutrient sources • Weathering of rock (K, P, Ca and many others) • Fixation of CO2 (photosynthesis) and N2 • Dryfall (particles in the atmosphere) • Wetfall (snow & rain); contains • Oxides of S, N • Aerosols • particles high in Na, Mg, Cl, S • produced by evaporation of droplets • Dust particles from fires, volcanoes • Ca, K, S
Terrestrial communities:Nutrient losses • Release to atmosphere • CO2 from respiration • Volatile hydrocarbons from leaves • Aerosols • NH3 (decomposition), N2 (denitrification) • Loss in streamflow • Dissolved nutrients • Particles
Oceans • No outflow • Detritus sinks --> mineralization --> nutrients end up: • Being carried back to surface in upwelling currents, or • Trapped in sediment (e.g., phosphorus: 1% lost to sediment with each cycling)
CARBON CYCLE CO2 • 4 PROCESSES MOVE CARBON THROUGH ITS CYCLE: • Biological • Geochemical • Mixed biochemical • Human Activity CO2
NITROGEN CYCLE N2 in Atmosphere • Nitrogen-containing nutrients include: • Ammonia (NH3) • Nitrate (NO3-) • Nitrite (NO2-) • ORGANISMS NEED NITROGEN TO MAKE AMINO ACIDS FOR BUILDING PROTEINS!!! N03- & N02- NH3
PHOSPHORUS CYCLE PHOSPHORUS FORMS PART OF IMPORTANT LIFE-SUSTAINING MOLECULES (ex. DNA & RNA)
We’re in the Driver’s Seat - Human Activities Dominate Many Biogeochemical Cycles