Download
1 / 27
270 likes | 276 Views
This update highlights the priorities for the Chesapeake Bay Program's Phase III Watershed Implementation Plans, including incorporating climate change considerations, understanding the science, and incorporating milestones.

E N D
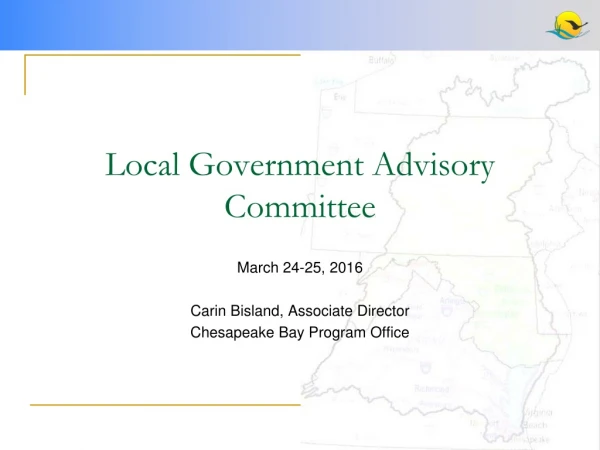
Local Government Advisory Committee Updates March 21, 2018 Carin Bisland, Associate Director Chesapeake Bay Program Office www.chesapeakebay.net www.chespeakeprogress.com
Phase III Watershed Implementation Plans • Timeline • Conowingo Watershed Implementation Plan • Climate Change • Growth in pollution load • Local Area Goals • BMP Verification
Factoring Climate Change Considerations into the Phase III Watershed Implementation Plans
1. Incorporate Climate Change in the Phase III WIPs Include a narrative strategy in the Phase III WIPs that describes the state and local jurisdictions’ current action plans and strategies to address climate change and commit to adopting climate change targetsby 2021, employing the Partnership’s suite of models that factor in climate change and other relevant local information. Acknowledging the challenges that lie ahead, reference the preliminary modeling estimates attributable to climate change by 2025 to be roughly an additional 9 million pounds of nitrogen and 0.5 million pounds of phosphorus.
2. Understand the Science • By refining the climate modeling and assessment framework, continue to sharpen the understanding of the science, the impacts of climate change, and any research gaps and needs. • Develop an estimate of pollutant load changes (nitrogen, phosphorus, and sediment) due to 2025 climate change conditions. • Develop a better understanding of BMP responses, including new, enhanced and resilient BMPs, to better address climate change conditions such as increased storm intensity. • In March 2021, the Partnership will consider results of updated methods, techniques, and studies and refine estimated loads due to climate change for each jurisdiction. • In September 2021 jurisdictions will account for additional nutrient and sediment pollutant loads due to 2025 climate change conditions in a Phase III WIP addendum and/or 2-year milestones beginning in 2022.
3. Incorporate into Milestones Starting with the 2022-2023 milestones, the Partnership will determine how climate change will impact the BMPs included in the WIPs and address these vulnerabilities in the two-year milestones.
PSC Policy Decisions: Accounting for Growth in Pollution Load Approved the Water Quality Goal Implementation Team’s recommended use of 2025 projected conditions(based on the current zoning scenario) to account for growth in the development and implementation of the jurisdictions’ Phase III WIPs and two-year milestones
PSC Policy Decisions: Accounting for Growth Approved the Water Quality Goal Implementation Team’s proposed approach to continued Partnership accounting for growth into the future by: • Updating the Partnership’s projection of future growth every two years • Factoring these updated future projections into next round of the jurisdictions’ two-year milestones • Factoring in future (every 4 years) updates to the Partnership’s high resolution land use/cover data across the entire watershed • Ensuring local partner review of the future growth forecasts with each 2-year update
What is BMP Verification? “Process through which agency partners ensure practices, treatments and technologies resulting in reductions of nitrogen, phosphorus and sediment pollutant loads are implemented and operating correctly.”
BMP no longer present/functional removed from database OR BMP installed, verified, and reported by Jurisdiction BMP verified/ upgraded with new technology Initial Inspection BMP gains efficiency Data quality assurance/ validation BMP lifespan ends – re-verify BMP Performance BMP nears end of life span Follow-up Checks BMP fully functional BMP performance metrics collected
When Would it Start? “Only Verified Practices may be Credited After the Initial Two Year Ramp-up Period. Starting with the 2018 annual progress reporting cycle, those reported practices, treatments or technologies for which documentation of verification has not been provided through each jurisdictions’ NEIEN-based report systems may not be credited for nitrogen, phosphorus or sediment pollutant load reductions for that year.” https://www.chesapeakebay.net/what/programs/bmp_introduction_to_bmp_verification/bmp_additional_resources
FY 2017 – 2019 CBP Budget and Funding Levels • FY 2017 Operating Budget - $73 Million for CBP • FY 2018 PresBud - $0 Funding for CBP and all EPA Geo Programs • FY 2018 Continuing Resolution – Through March 23, 2018 • FY 2018 – House Bill: CBP @ $60 Million; Senate Bill: CBP @ $73 Million • FY 2019 PresBud - $7.3 Million for CBP; 0 FTE; $30 Million for Great Lakes
FY 17 Budget Highlights • EPA Budget - • Funds • $5 million for Implementation • $6 million for Small Watershed Grants • $6 million for Innovative Nutrient and Sediment Reduction Grants • ACB Grant for LGAC Support • Staffing • Reggie Parrish • Other federal and state funds
FY 2019 CBP PresBud CBP Language • “…Chesapeake Bay. These watersheds require coordination and collaboration among numerous States, Tribes, and local governments. In the case of the Great Lakes, international coordination with Canada is also necessary. Effective coordination and collaboration among these stakeholders relies on accurate and continuous data. • The Budget provides funds to support basin-wide monitoring in these watersheds, which would assist decision-making on health and economic issues including harmful algal blooms and invasive species management. The Budget also supports cooperative federalism by building State and local capacity to conduct monitoring, while recognizing that the primary responsibility for local ecosystem restoration rests with States and local groups.”
Document: Fiscal Year 2019 President’s Budget “The Budget funds programs to measure and assess the health of the Great Lakes and Chesapeake Bay. These watersheds require coordination and collaboration among numerous States, Tribes, and local governments… “The Budget also supports cooperative federalism by building State and local capacity to conduct monitoring, while recognizing that the primary responsibility for local ecosystem restoration rests with States and local groups.” Document: Justification of Appropriation Estimates for the Committee on Appropriations Geographic Program: Chesapeake Bay (Dollars in Thousands)
Document: Justification of Appropriation Estimates for the Committee on Appropriations FY 2019 Activities and Performance Plan: In FY 2019, EPA is requesting $7.3 million for support of state and local collection of water quality monitoring data and coordination of science, research, and modeling. Work in this program directly supports Goal 1/Objective 1.2, Provide Clean and Safe Water in EPA's FY 2018 - 2022 Strategic Plan. The $7.3 million requested in FY 2019 would support the following activities: • Water quality monitoring ($5.2 million). This funding would leverage between $10-$12 million in combined federal, state, and local funds. • Tidal and non-tidal monitoring ($4.8 million). • Submerged Aquatic Vegetation (SAV) monitoring ($400 thousand). • Provide facilitation to build capacity at the state level ($2.1 million). • Coordinate modeling, decision support services, data collection, analysis, storage, and access; • Support information dissemination and transparency; and • Provide consistency and efficiency in communications and data management.
Federal Data Table 1– Federal Agency Totals1 1 In all tables, funding amounts are rounded to the nearest thousand. Rounding errors may result. 2Though DOT is a member of the Chesapeake Bay Federal Leadership Committee and conducts environmental-related activities in the Chesapeake Bay watershed, none meet the definitional limits of this crosscut.
State Program Spending Funding levels reported in millions of dollars.
Questions? 27