Download
1 / 45
450 likes | 545 Views
Resource Stewardship Monitoring Program Riparian, Stream & Fish Habitat Assessments 2005. Peter J. Tschaplinski Research Branch Ministry of Forests and Range. Assessment Scope. 2004 Riparian Pilot: 5 districts 47 streams

E N D
Resource Stewardship Monitoring ProgramRiparian, Stream & Fish Habitat Assessments2005 PeterJ. TschaplinskiResearch BranchMinistry of Forests and Range
Assessment Scope • 2004 Riparian Pilot: 5 districts 47 streams • 2005 Operational Surveys: 19 districts 250 streams • 2006 Surveys: All 29 Districts?
Forest Districts Participating Coast Forest Region Campbell River Chilliwack North Island – Central Coast Queen Charlotte Islands South Island Squamish
Forest Districts Participating Northern Interior Forest Region Fort Nelson Fort St. James Kalum Mackenzie Nadina Prince George Vanderhoof
Forest Districts Participating Southern Interior Forest Region Arrow Boundary Cascades Central Cariboo Chilcotin Kamloops Quesnel
EffectivenessEvaluationObjective for the Fish Value • Determine whether FRPA standards and practices governed by regulation are achieving the desired result of protecting fish values. • Includes aquatic ecosystems and adjacent riparian areas • Current focus remains on streams • Sites assessed so far are FP Code streams
Evaluation Approach • Assess physical and biological conditions in streams and their riparian areas • Describe conditions with Routine-Level Checklist covering 15 indicators • Score each Indicator as “Yes = OK” vs. “No = problem” • Roll-up score = overall site condition
Roll-up Scoring System Frequency of “No” Indicators out of 15: 1. Functioning 0 - 2 No’s 2. Functioning, at Risk 3 - 4 No’s 3. Functioning, at High Risk 5 - 6 No’s 4. Non-functioning > 6 No’s
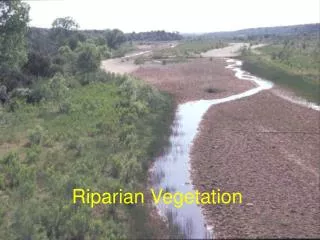
1. Channel bed disturbance 2. Channel bank disturbance 3. LWD characteristics 4. Channel morphology 5. Aquatic connectivity 6. Fish cover diversity 7. Moss abundance & condition 8. Fine sediments 9. Aquatic invertebrate diversity 10. Windthrow frequency 11. Riparian soil disturbance/ bare ground 12. LWD supply/root network 13. Shade & microclimate 14. Disturbance-increaser plants 15. Vegetation form, vigour, & structure Aquatic-Riparian Indicators
RelatingScorestoForestry • This is the hard part. • Explain stream and riparian conditions in terms of required/permitted practices. • Considerations include: 1. Tree retention standards by stream class: RRZs for S1 – S3; RMZs for S4, S5, & S6 2. Riparian ground disturbance, windthrow 3. Causal factors, e.g., roads and road crossings 4. Effects from upstream areas/activities 5. Compare with “undisturbed” conditions (e.g.,upstream reference sites)
RSMP Objectives • Operational assessments of post-harvest conditions of streams, riparian areas, and fish habitats. • Continuous improvement feedback: • Forestry practices affecting riparian areas, streams and fish habitat • Refine assessments: indicators and methods • Clear, practical, complete • Improve training and support materials
SummaryObservations • Surveys done thoroughly and accurately • Good representation of FPC sites across stream classes • Feedback from field staff indicate need for: • Further checklist clarifications, diagrams, and tip notes • Better description of what is meant by “impact sources” • Associated protocol improvements • Results show a mixture of riparian management androad-related effects • Low tree retention identified as the most frequent impact factor • Road & crossing effects may be associated with the highest levelof impact (high risk and non-functioning stream reaches)