Download
1 / 1
10 likes | 94 Views
B A R R I E R S T O E N E R G Y A D O P T I O N I N P O R T L A N D. BACKGROUND. METHODOLOGY. What barriers exist that discourage consumers from purchasing energy alternatives for their household electricity use in the Portland metropolitan area?.

E N D
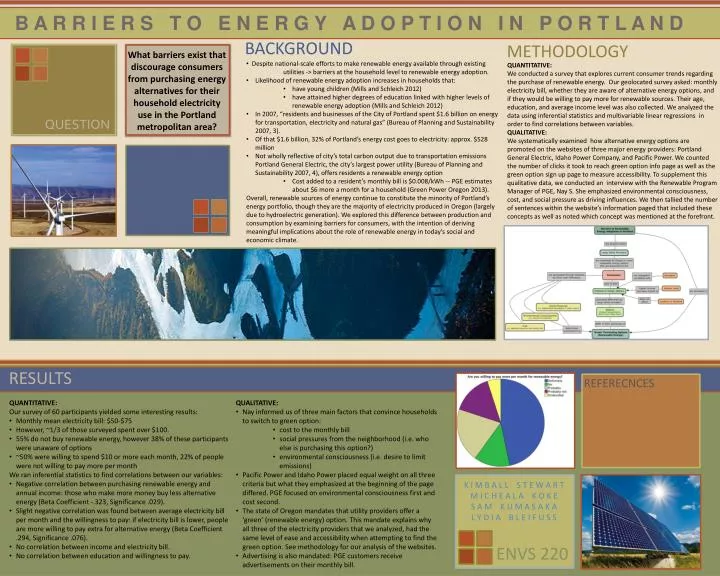
B A R R I E R S T O E N E R G Y A D O P T I O N I N P O R T L A N D BACKGROUND METHODOLOGY What barriers exist that discourage consumers from purchasing energy alternatives for their household electricity use in the Portland metropolitan area? • Despite national-scale efforts to make renewable energy available through existing utilities -> barriers at the household level to renewable energy adoption. • Likelihood of renewable energy adoption increases in households that: • have young children (Mills and Schleich 2012) • have attained higher degrees of education linked with higher levels of renewable energy adoption (Mills and Schleich 2012) • In 2007, “residents and businesses of the City of Portland spent $1.6 billion on energy for transportation, electricity and natural gas” (Bureau of Planning and Sustainability 2007, 3). • Of that $1.6 billion, 32% of Portland’s energy cost goes to electricity: approx. $528 million • Not wholly reflective of city’s total carbon output due to transportation emissions Portland General Electric, the city’s largest power utility (Bureau of Planning and Sustainability 2007, 4), offers residents a renewable energy option • Cost added to a resident’s monthly bill is $0.008/kWh -- PGE estimates about $6 more a month for a household (Green Power Oregon 2013). • Overall, renewable sources of energy continue to constitute the minority of Portland’s energy portfolio, though they are the majority of electricity produced in Oregon (largely due to hydroelectric generation). We explored this difference between production and consumption by examining barriers for consumers, with the intention of deriving meaningful implications about the role of renewable energy in today’s social and economic climate. QUANTITATIVE: We conducted a survey that explores current consumer trends regarding the purchase of renewable energy. Our geolocated survey asked: monthly electricity bill, whether they are aware of alternative energy options, and if they would be willing to pay more for renewable sources. Their age, education, and average income level was also collected. We analyzed the data using inferential statistics and multivariable linear regressions in order to find correlations between variables. QUALITATIVE: We systematically examined how alternative energy options are promoted on the websites of three major energy providers: Portland General Electric, Idaho Power Company, and Pacific Power. We counted the number of clicks it took to reach green option info page as well as the green option sign up page to measure accessibility. To supplement this qualitative data, we conducted an interview with the Renewable Program Manager of PGE, Nay S. She emphasized environmental consciousness, cost, and social pressure as driving influences. We then tallied the number of sentences within the website’s information paged that included these concepts as well as noted which concept was mentioned at the forefront. QUESTION RESULTS REFERECNCES • QUANTITATIVE: • Our survey of 60 participants yielded some interesting results: • Monthly mean electricity bill: $50-$75 • However, ~1/3 of those surveyed spent over $100. • 55% do not buy renewable energy, however 38% of these participants were unaware of options • ~50% were willing to spend $10 or more each month, 22% of people were not willing to pay more per month • We ran inferential statistics to find correlations between our variables: • Negative correlation between purchasing renewable energy and annual income: those who make more money buy less alternative energy (Beta Coefficient -.323, Significance .029). • Slight negative correlation was found between average electricity bill per month and the willingness to pay: if electricity bill is lower, people are more willing to pay extra for alternative energy (Beta Coefficient .294, Significance .076). • No correlation between income and electricity bill. • No correlation between education and willingness to pay. • QUALITATIVE: • Nay informed us of three main factors that convince households to switch to green option: • cost to the monthly bill • social pressures from the neighborhood (i.e. who else is purchasing this option?) • environmental consciousness (i.e. desire to limit emissions) • Pacific Power and Idaho Power placed equal weight on all three criteria but what they emphasized at the beginning of the page differed. PGE focused on environmental consciousness first and cost second. • The state of Oregon mandates that utility providers offer a ‘green’ (renewable energy) option. This mandate explains why all three of the electricity providers that we analyzed, had the same level of ease and accessibility when attempting to find the green option. See methodology for our analysis of the websites. • Advertising is also mandated: PGE customers receive advertisements on their monthly bill. K I M B A L L S T E W A R T M I C H E A L A K O K E S A M K U M A S A K A L Y D I A B L E I F U S S ENVS 220