Download
1 / 19
190 likes | 285 Views
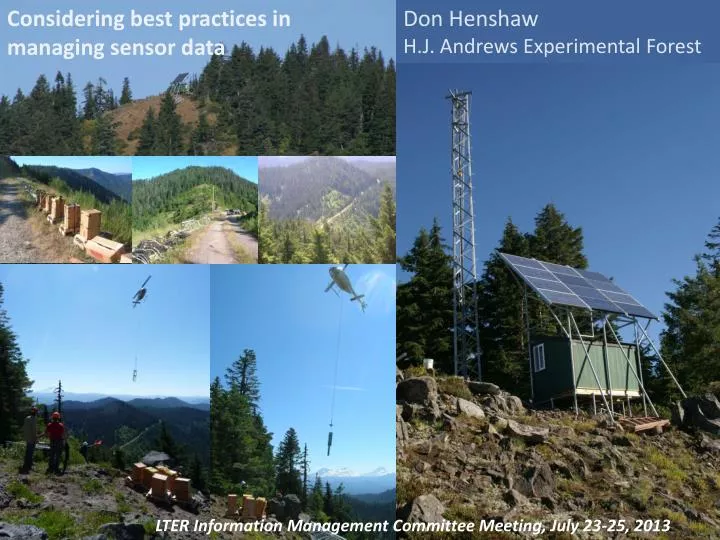
Considering best practices in managing sensor data. Don Henshaw H.J. Andrews Experimental Forest. LTER Information Management Committee Meeting, July 23-25, 2013.

E N D
Considering best practices in managing sensor data Don Henshaw H.J. Andrews Experimental Forest Ecological Information Management (EIM) 2008 LTER Information Management Committee Meeting, July 23-25, 2013
Common Themes from participating sitesJoint NERC Environmental Sensor Network/Sensor NIS Workshop, Hubbard Brook Experimental Forest, NH, October 25-27th, 2011 • Greatest Needs • Middleware between sensor/data logger and database/applications • Programming support • Training workshops to disseminate knowledge & solutions • Ways to share experiences with software and tools that are useful • Clearinghouse for sharing code and solutions • Knowledge Base (web page) organized by topics (http://wiki.esipfed.org/index.php/EnviroSensing_Cluster) LTER Information Management Committee Meeting, July 23-25, 2013
Joint NERC Environmental Sensor Network/LTER SensorNIS Workshop, October 25-27th, 2011
ESIP EnviroSensing Cluster: Building a sensor network resource guide through community participation • Online resource guide outline • Sensor, site, and platform selection • Data acquisition and transmission • Sensor management, tracking, documentation • Streaming data management middleware • Sensor data quality assurance/quality control (QA/QC) • Sensor data archiving Software Tools for Sensor Networks, April 23-26, 2013
Sensor, site, and platform selection • Problem statement • Vast array of possible sensor/hardware packages for multiple science applications • Communication among PI’s, techs, and specialists • work together in considering options and planning • Deployment may be based on interacting factors • e.g., permitting, geography, access • Considerations: • seasonal weather patterns, power sources, communications options, land ownership, distance from managing institution, available personnel/expertise, and potential expansion/future-proofing LTER Information Management Committee Meeting, July 23-25, 2013
Data acquisition and transmission • Problem statement • Manual downloads of environmental sensor data may not be sufficient to assure data security or data integrity, or allow direct control of devices • Considerations: • need for immediate access • need for one- or two-way transmission methods • bandwidth requirements to transfer the data • need for line-of-site communication or repeaters • hardware and network protocols • power consumption of the system components • physical and network security requirements LTER Information Management Committee Meeting, July 23-25, 2013
Sensor management, tracking, and documentation • Problem statement • Documentation of field procedures need to be sufficient to withstand personnel changes over time • Noted sensor issues and problems need to be quickly communicated among field technicians, lead investigators and data managers • Sensor histories are typically tracked in field notebooks or field check sheets and are essential for internal review of data streams, but are often inaccessible to data handlers • Noted field problems may provide insight into quality control issues and data behavior and should be captured in data qualifier flags LTER Information Management Committee Meeting, July 23-25, 2013
Sensor Management, tracking, documentation • Develop protocols for installation, calibration, maintenance, and removal of sensors • Track sensor events and history • Record sensor events and failures, deployment information, calibration events, maintenance history, operational dates, etc. • Record sensor descriptions, methodology changes, sampling frequency, geo-location, photo points, etc. • Documentation • Standardize field notebooks or field checklists • Build log files or databases for annotation of sensor events, e.g., • Timestamp (or range), DataloggerID, SensorID, event category, description and note taker of event Software Tools for Sensor Networks Training, 1 May 2012 LTER Information Management Committee Meeting, July 23-25, 2013
Sensor data quality assurance and quality control (QA/QC) • Preventative QA measures in the field are desirable • Automated QC is necessary for • near real-time use of data • efficient processing of high volume data streams • Manual methods are unavoidable • a hybrid QC system will include subsequent manual inspection and additional QC checking • QC system must • provide qualifier flags to sensor data • accommodate feedback to policies and procedures • assure that all QC workflows are documented LTER Information Management Committee Meeting, July 23-25, 2013
Quality Assurance – preventative measures • Routine calibration and maintenance • Anticipate common repairs and replacement parts • Record known events that may impact measurements • Continuous monitoring and evaluating of sensor network • Early detection of problems • Automated alerts; in situ web cams • Sensor redundancy • Ideal: Triple the sensor, triple the logger! • Practical: Cheaper, lower cost, lower resolution sensors, or correlated (proxy) sensors • Alternative: Datalogger-independent sensor spot checks; portable instrument package LTER Information Management Committee Meeting, July 23-25, 2013
Quality control on Streaming Data: Possible quality control checks in near real-time • Timestamp integrity (Date/time) • Sequential, fixed intervals, i.e., checks for time step or frequency variation • Range checks • Sensor specifications - identify impossible values; not unlikely ones • Seasonal/reasonable historic values • Internal (plausibility) checks • E.g., TMAX-TMIN>0, snow depth>snow water equivalence • Consistency of derived values • Variance checks • Sigma (standard deviation), Delta/step (difference of subsequent pairs), change in slope checks • e.g., outlier detections, indicator of sensor degradation • Sensitivity is specific to site and sensor type • Persistence checks • Check for repeating values that may indicate sensor failure • E.g., freezing, sensor capacity issues • Spatial checks • Use correlations with redundant or nearby sensors, e.g., check for sensor drift LTER Information Management Committee Meeting, July 23-25, 2013
Quality control on Streaming Data:Data Qualifiers (data flags) • Many vocabularies of data flags • Good approach • Rich vocabulary of fine-grained flags for streaming data – intended to guide local review • site-specific flags • Simpler vocabulary of flags for “final” data for public consumption, e.g., • ‘Accepted’, ‘Missing’, ‘Estimated’, ‘Suspicious’, estimate uncertainty • Certain types of qualifiers may be better as data columns • Method shifts, sensor shifts • Place key documentation as close to data value as possible Image from Campbell et.al., Bioscience, In Press.
Sensor data archiving • Archiving strategies • create well documented data snapshots • assign unique, persistent identifiers • maintain data and metadata versioning • store data in text-based formats • Partner with community supported archives • E.g., the LTER NIS, or federated archive initiatives such as DataONE • Best practices • develop an archival data management plan • implement a sound data backup plan • archive raw data (but they do not need to be online) • make data publicly available that have appropriate QA/QC procedures applied • assign QC level to published data sets LTER Information Management Committee Meeting, July 23-25, 2013
Quality control on Streaming Data:Quality Levels • Quality control is performed at multiple levels • Level 0 (Raw streaming data) • Raw data, no QC, no data qualifiers applied (data flags) • Preservation of original data streams is essential • Level 1 (QC applied, qualifiers added) • Provisional level (near real-time preparation) • if released, provisional data must be labeled clearly • Published level (delayed release) • QC process is complete; data is unlikely to change • Level 2 (Gap-filled or estimated data) • Involves interpretation – may be controversial • Desirable when generating summarized data, but transparency critical – flag estimated values LTER Information Management Committee Meeting, July 23-25, 2013
Streaming data management middleware • Definition/Purpose • “Middleware” in conjunction with sensor networks is computer software that enables communication and management of data from field sensors to a client such as a database or a website • Purpose of middleware includes the collection, analysis, and visualization of data • Middleware is chained together into a scientific workflow • Examples: • Read, reformat, export of different data types or structures (input/output) • Automated QA/QC on data streams • Integration of field notes and documentation with the data • Archiving LTER Information Management Committee Meeting, July 23-25, 2013
Streaming data management middleware • Middleware/software – Proprietary • Campbell Scientific LoggerNet • functionality to set up and configure a network of loggers • tools to program, visualize, monitor, and publish data • Vista Engineering: Vista Data Vision (VDV) • tools to store and organize data from various loggers • visualization, alarming, reporting, and web publishing features • YSI EcoNet (for YSI monitoring instrumentation) • delivery of data from the field to the YSI web server • visualization, reports, alarms, and email notification tools • NexSens: iChart • Windows-based data acquisition software package • interfaces with popular products such as YSI, OTT, ISCO sensors LTER Information Management Committee Meeting, July 23-25, 2013
Sensor Data Management Middleware Open Source Environments for Streaming Data • Matlab GCE toolbox (Proprietary/ limited open source) • GUI, visualization, metadata-based analysis, manages QA/QC rules and qualifiers, tracks provenance • Open Source DataTurbine Initiative • Streaming data engine, receives data from various sources and sends to analysis and visualization tools, databases, etc. • Kepler Project (open source) • GUI, reuse and share analytical components/workflows with other users, tracks provenance, integrates software components and data sources
Sensor Management Best Practices Workshop Participants • Don Henshaw (AND) - organizerCorinna Gries (NTL) - organizerRenee Brown (SEV)Adam Kennedy (AND)Richard Cary (CWT)Mary Martin (HBR)Christine Laney (UTEP, JRN)Jennifer Morse (NWT)Chris Jones (DataONE)Branko Zdravkovic (Univ of Saskatchewan)Scotty Strachan (Univ of Nevada-Reno) • Jordan Read (USGS) - vtcWade Sheldon (GCE) - vtc LTER Information Management Committee Meeting, July 23-25, 2013