Download
1 / 1
10 likes | 78 Views
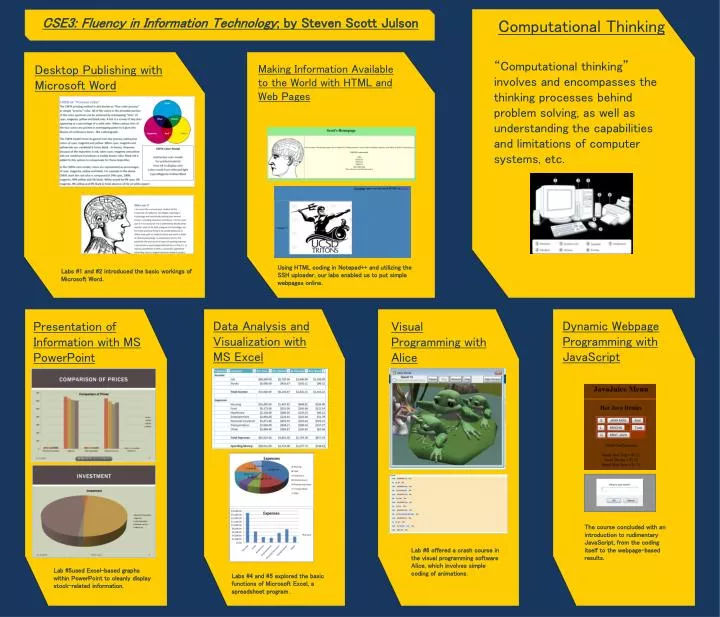
CSE3: Fluency in Information Technology ; by Steven Scott Julson. Computational Thinking. “Computational thinking” involves and encompasses the thinking processes behind problem solving, as well as understanding the capabilities and limitations of computer systems, etc.

E N D
CSE3: Fluency in Information Technology;by Steven Scott Julson Computational Thinking “Computational thinking” involves and encompasses the thinking processes behind problem solving, as well as understanding the capabilities and limitations of computer systems, etc. Desktop Publishing with Microsoft Word Making Information Available to the World with HTML and Web Pages Using HTML coding in Notepad++ and utilizing the SSH uploader, our labs enabled us to put simple webpages online. Labs #1 and #2 introduced the basic workings of Microsoft Word. Data Analysis and Visualization with MS Excel Dynamic Webpage Programming with JavaScript Presentation of Information with MS PowerPoint Visual Programming with Alice The course concluded with an introduction to rudimentary JavaScript, from the coding itself to the webpage-based results. Lab #6 offered a crash course in the visual programming software Alice, which involves simple coding of animations. Lab #5used Excel-based graphs within PowerPoint to cleanly display stock-related information. Labs #4 and #5 explored the basic functions of Microsoft Excel, a spreadsheet program..