Download
1 / 50
500 likes | 610 Views
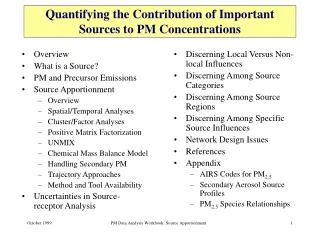
Quality Assured Measurements of Animal Building Emissions: Part 1. Gas Concentrations. Albert Heber; Ji-Qin Ni; Teng Lim; Pei-Chun Tao Purdue University, West Lafayette, IN Amy M. Millmier University of Missouri, Columbia, MO Larry Jacobson, Richard Nicolai

E N D
Quality Assured Measurements of Animal Building Emissions: Part 1. Gas Concentrations Albert Heber; Ji-Qin Ni; Teng Lim; Pei-Chun Tao Purdue University, West Lafayette, IN Amy M. Millmier University of Missouri, Columbia, MO Larry Jacobson, Richard Nicolai University of Minnesota, St. Paul, MN Jacek Koziel Texas A&M University, Amarillo, TX Steven Hoff Iowa State University, Ames, IA Yuanhui Zhang University of Illinois, Urbana, IL David Beasley North Carolina State University, Raleigh, NC
Dr. Ji-Qin Ni Dr. Teng Lim
Feed Waste H2S, NH3 Eggs “Livestock take a relatively benign N (and S) in the feed and convert it to a susceptible, volatile, and mobile form of N (and S)” H. Tyrell 4/29/02
Storage/Treatment Housing Emission Sources Land Application Source: Arogo et al. 2001
1996-97 Air Quality Study 3,500 data subsets were collected between March and September
Instrument Shelter Sampling Manifolds Gas analyzers PC Full-time field engineer
Pegged! Concentration, ppm Summer Winter Carbon Dioxide Concentrations • Photoacoustic infrared • 1.0 Lpm internal pump • 0 - 5,000 ppm • Model 3600, MSA, Inc. • $2,000 Zero and span calibration gases
H2S Concentrations(pulsed fluorescence technique) Site 3 H2S odor threshold concentration = 1 ppb 1 to 1,527 ppb
NH3 Concentrations(chemiluminescence method) NH3 odor threshold concentration ~ 5 ppm
Sampling manifold Sampling Location Group (SLG) Instrument trailer Analyzers Pit fan Wall fans Mixing manifold Teflon manifolds
Problems • Condensation in gas lines. • Keep gas temperature 3 C above that of sampled air. • Air conditioning in trailer caused condensation. • Sensor failure and drift. • Lack of sensor maintenance, e.g. psychrometer ran dry. • Lightning strikes (need UPS systems) • PC hard drive failed. • Dust and moisture buildups in gas sampling lines. • Pigs damaged several sensors and lines. • Harsh environment for sensors.
Recommendations from 1997 Study • Develop Quality Assurance Project Plan (needed or not) • Test, evaluate and fine-tune DAQ before taking to field • Test field installation and data analysis before collecting data • Assure good field site management • Establish good communication with collaborator • Keep gas temperature 3 C above that of sampled air. • Protect integrity of data collection/storage • Use proper statistical techniques • Proper sampling frequency/locations • Sufficient accuracy • Estimate and propagate all errors • Use proper averaging methods
Manure Additive Study, 1999 Hood failure: 1000’s emails! • First QAQC-based contract • Web-based Labview data monitoring • Biweekly calibrations • 39 reactors PC DAQ Gas Sampling System (GSS) Backup Analyzers Calibration notebooks
Documentation of procedures • Accurate records • Reference gases for CEM. • Reactor ventilation monitoring • Email of alarms to reseachers. • Monitoring of all exhaust hoods in lab • Blank checks. • Pilot Study
Real Time Gas Monitoring Reactor Number Hydrogen sulfide Ammonia Carbon dioxide Reactor airflow
Emission Measurement Methods Study – 2001-2002 • “Air Sampling & Measurement Methodology for Confined Animal Housing Systems” • “Improving Measurement of Emissions from Poultry Houses” • “Odor Emissions Factors for Caged-Layers” • “Real-time Dust Concentration Monitor”
CL Method: Spatial 9 exhaust locations 1 inlet location 2 cage location 10 min sampling period CL Method: Temporal 1 exhaust location Continuous monitoring Photoacoustric IR Electrochemical sensors
Six months of gas sampling • Analyzer comparisons • Bypass pumping tests • Sampling period 5-10 min • Labview DAQ & Computer Boards • First test of TEOM • Ammonia 15 to 150 ppm • QAQC-based contract • Wireless ISP • Web publishing of data • Lightning arrestor for IS • Microwave oven • Small vane anemometers
Monitoring Plan at Laying House Ammonia emission = k x 186 m3/s x (25.3 – 1.6) = 11,267 g/d
APECAB Study Aerial: Air quality new EPA initiative for ag. Pollutant: Volatile forms of N, S, odor. Emissions: Outward mass flows from barns. from Confined: Efficient method of raising animals. Animals: Swine is the focus in this study Buildings: Mechanically-ventilated rooms only.
Measurement Sites: APECAB study All sites described in paper Swine Poultry
Met tower Thermocouple Air sampling To instrument shelter Cages Barn A (not shown) Barn B Anemometer (SVA) Pit RH/Temp probe Static pressure port Cross-sectional view Instrument shelter E67 E47 1 2 Exhaust air locations Mixing manifold 6 Air inlet group Animal exposure group 5 Floor plan (186 m x 30 m) Exhaust air locations 4 3 Fan number W1 W20 N Hall Instrument shelter Side view Attic Cages Pit
Hall Hall Barns 1-12 Barn 13 Barn 14 Barn 15 Barn 16 Feed bins N Lab Service road
Control of Aerial Pollutant Emissions from Swine Housing (CAPESH) • Test soybean oil sprinkling • Test the “Biocurtain”
Lagoon Tunnel-ventilated finishing houses with flushing
Mobile Instrument Shelters CAPESH study APECAB study
* * * * * Met tower Relative humidity/temperature probe TEOM sampler for PM10 Barn 7 Barn 8 Air sampling Anemometer (SVA) Static pressure port Temperature sensor Odor sampling location End view End view Trailer Summer air inlets Fan # 5 Barn 7 3 1 Floor plan (61 m x 13.2 m) 2 4 Instrument trailer S Background air sampling * Attic 1-5 * Pens Diffusers Side View Shallow pit with recycle flush Exhaust air sampling
M1 1 1 p Bypass pumping circuit P: pump Exhaust S: solenoid M: manifold 9.5 mm OD, 6.4 mm ID Teflon F: filter 7.9 mm OD, 4.8 mm ID vinyl P1 Sampling probes, 10-115 m long 6.4 mm OD 3.2 mm ID vinyl 22.2 mm OD 15.9 mm ID vinyl Analyzers F NH3 S1 Bag fill port F P3 Pressure sensor M3 H2S F Mass flow meter CO2 M2 f 9.5 mm OD, 6.4 mm ID Teflon CH4/VOC Flow restrictors P2 Calibration gas circuit Exhaust D M4 Cal gases S12 B A C S14 6-solenoid manifold C6H14/CH4 Bubbler SO2 S13 H2S NH3 NO 6-port diluter (5 L/min) CO2 Note: S1-S6: NO, S7-S12: NC 3.2 mm OD, 1.6 mm ID Teflon Zero air Air valve Rotameter Leak test circuit P4 Pressure gage Jar
3-way solenoid Bypass manifold M1 Bag fill port Sampling manifold M2 Analyzer sampling manifold M3 M4 Bypass pump P1 Sampling pump P2
¼” i.d. 3/8” o.d. Teflon Sampled air from sampling location group (SLG) 3-way solenoid Flow restrictor Mass flow meter 0-10 L/min
Sample airflow & manifold pressure 1: Ambient, 2: Barn A, 3: Barn B
On-Line Data Inspection Flushing peak Barn B Barn A Ambient
The Measurement System • Sample system • Sample acquisition • Sample transport • Sample conditioning • Protection of analyzers from sampled gas • Gas analyzer: senses and generates output • Data recorder
NH3 analyzer Pump Catalytic converter Solenoid Filter PMT RC A Capillary Scrubber Internal gas sampling system Detector 0.6 L/min Calibration at A accounts for converter inefficiency and losses in scrubber, solenoid, capillary, filter and tubing along with detector sensitivity.
p Calibration at D accounts for additional error introduced by the long sampling probes and is the most desirable location to introduce calibration gas but is sometimes too impractical. External gas sampling system NH3 analyzer Pump Manifold Catalytic converter 10-123 m Teflon tube Manifold Solenoid Filter D C PMT RC Restrictor A Capillary Scrubber f Filter Mass flow meter Solenoid Internal gas sampling system Pump Detector Pressure sensor 0.6 L/min B Calibration at A accounts for converter inefficiency and losses in scrubber, solenoid, capillary, filter and tubing along with detector sensitivity. 4.0 L/min Calibration at B or C accounts for additional error introduced by the external gas sampling system.
Recent Advances to Emission Measurements at Livestock Buildings • New gas sampling system with mass flow sensor and manifold pressure sensor • Complete QAPP documents • Remote multipoint calibrations • Introduction of cal gas into probe • Non-methane VOC measurements • Common protocol among universities
Building Environment Research & Education AgAirQuality.com Albert J. HeberProfessor Agricultural and Biological Engineering Purdue University
Thank you! Check out www.AgAirQuality.com