Download
1 / 18
180 likes | 184 Views
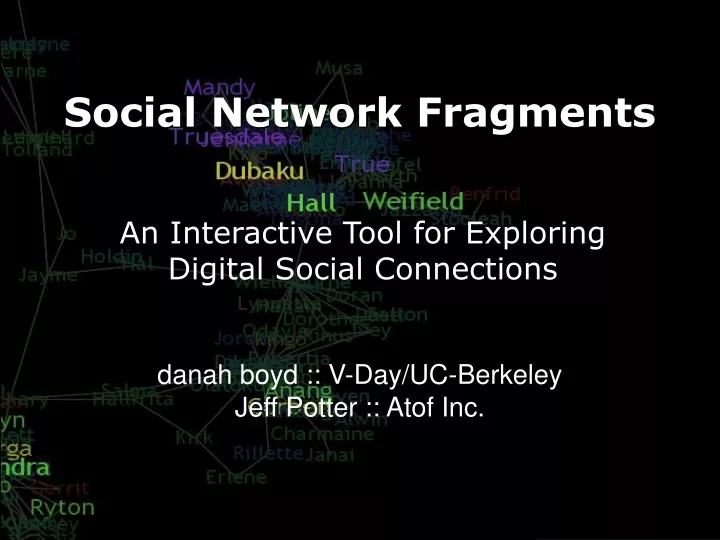
Social Network Fragments. An Interactive Tool for Exploring Digital Social Connections. danah boyd :: V-Day/UC-Berkeley Jeff Potter :: Atof Inc. What is Social Network Fragments (SNF)?. A visualization of email based social networks Revealing behavior-driven networks

E N D
Social Network Fragments An Interactive Tool for Exploring Digital Social Connections danah boyd :: V-Day/UC-Berkeley Jeff Potter :: Atof Inc.
What is Social Network Fragments (SNF)? • A visualization of email based social networks • Revealing behavior-driven networks • An interactive tool for exploring one’s digital history • Focused on social uses, not efficiency of information access • An artifact for storytelling and sharing • Focused on personal information retrieval
Intention • Reveal email patterns for individuals to understand their behavior • Social networks • Email exchange rhythms • Answer social questions • What does one’s network structure look like? • How does it evolve over time? • How do individuals segment their network? • Are clusters connected via a common role or definable community? • What are the role of bridges?
Visualization + Ethnography • Highly dimensional data • Visualization reveals patterns • Interactive, visually compelling tool allows for exploration • We emphasize social information • Ethnographic conversation for researcher understanding of behavior • Data more meaningful to individual represented
Functionality: Analyzing Email • Analyze email headers • To, CC, and BCC fields • Code relationships • Knowledge ties vs. Awareness Ties • Listservs • BCC for level of trust • Code roles in relationships • Work vs. School vs. Personal • Communities over time
Functionality: Visualization • Spring system algorithm for layout • Maximize proximity of related people • Visualize roles via color • Present via an interactive animation that changes over time • Navigate people and time • Zoom into regions of the network
Users & Usage • Visualized 6 people’s data • Two had email spools back through 1997 • Conversations with users about their experience • What was revealed through visualization • Users also shared with others • We recorded these anecdotes
Watching oneself evolve “I remember looking at the difference in my social world from school, then my first job. It really struck me how much my entire landscape changed during these transitions – almost all of the support roles in my life changed […]. My first job comes up at the same time that hundreds of people from school disappear.” - One user’s reaction based on the animation of his network
Group Sharing “The list hadn't been used in well over 2 years, but the visualization prompted an impressive walk down memory lane, as people pointed out specific connections and why they emerged at that time […]. The little slice of history allowed the group to reconnect by providing the reminder of what had made us close in the first place.” - One user showed a screenshot from 1998 to a long-term support group
Sharing with loved ones “I learned some little things about him that he had never mentioned before, like the fact that he was in a string quartet – suddenly there's a little cluster of names all one color off in the corner: 'Who are they?' I ask. 'Oh, that's the string quartet I was in.' 'You were in a string quartet?'” - From one user’s boyfriend
Sharing the visualizations • Social Network Fragments was designed personal exploration but sharing allowed for storytelling • Users felt safe sharing their networks • “Sure, my closest friends could tell what those clusters were and why they were so significant to me. But very few people had access to all of the different social circles that I knew and maintained.”
Privacy concerns • The system reveals extensive information about friends’ networks • “Where did you get that?!?!” (a friend horrified upon realizing that her network is known externally) • External organizations see value in observing others’ networks
Ethnographic Understanding • Role and time-based clusters • Work vs. home vs. school • Control of bridges depends on people’s self-monitoring habits • Based on culture, marginalization? • Rich understanding of one’s network emerges with visualization • Artifact as tool for personal anecdotes
The Future • Interest in social networks is growing • People want to access and utilize their networks for fun and work • Over a dozen articulated network systems • Popularity of Friendster (1.3 million users) • Interactive visualizations help people understand, use and share their networks • Articulated vs. behavior-driven networks • Further ethnographic work needed
More information • Social Network Fragments emerged at the MIT Media Lab (Sociable Media Group) in collaboration with Atof Inc. as an extension of BuddyGraph • http://smg.media.mit.edu/projects/SNF/ • http://www.buddygraph.com/ • For more information, email danah • siggraph@danah.org