Download
1 / 3
110 likes | 540 Views
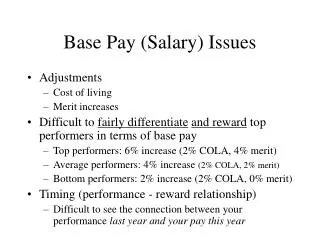
Salary Structures and Pay Grade Dimensions. Pay Grade Width Distance from min. to max. of range Typical ranges are 30-40 percent Midpoint to Midpoint Difference Represents pay differential from one pay grade to the next one in a sequence Must be Meaningful in amount

E N D
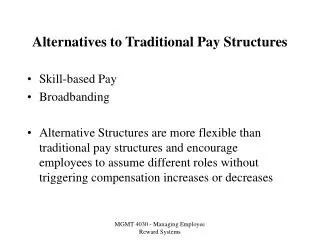
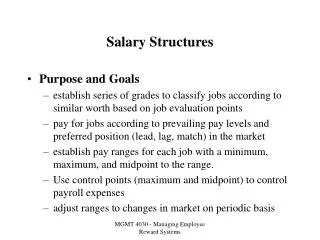
Salary Structures and Pay Grade Dimensions • Pay Grade Width • Distance from min. to max. of range • Typical ranges are 30-40 percent • Midpoint to Midpoint Difference • Represents pay differential from one pay grade to the next one in a sequence • Must be Meaningful in amount • Ranges from 8 percent (non-exempts) to • 12 percent (management and exempts) MGMT 4030 - Managing Employee Reward Systems
Pay Grade Dimensions • Pay Grade Overlap • Salaries that are Common to adjacent Pay Grades. • Overlap gives managers flexibility to move employees to higher grades when promoted without an overly generous pay raise. • Too much overlap leads to pay inequity, too little overlap causes barriers to promotion and inefficiencies • Compa Ratio • The Average of all actual salaries in a pay grade divided by the midpoint of the range MGMT 4030 - Managing Employee Reward Systems
Pay grade Dimensions • Compa Ratio (Continued) • Compa Ratios let Compensation Managers view the distribution of salaries and identify grades that are out of control - too many above, or too many below the desired pay policy position in the market indicates a problem. • CR > 1.10 is quite high • CR < .90 is quite low • CR = 1.00 is the ideal • Red Circle Pay Rates • Pay Rate above the maximum for special situations such as outstanding employee that requires executive approval MGMT 4030 - Managing Employee Reward Systems