Download
1 / 33
330 likes | 400 Views
DI Water Reduction in Rinse Processes. Contributions by: Thomas W. Peterson, University of Arizona Andy Hebda, University of Arizona Thomas Roche, Motorola Corp. Eric Hansen, Santa Clara Plastics 1999 Arizona Board of Regents for The University of Arizona. DI water use during rinsing:

E N D
DI Water Reduction in Rinse Processes Contributions by: Thomas W. Peterson, University of Arizona Andy Hebda, University of Arizona Thomas Roche, Motorola Corp. Eric Hansen, Santa Clara Plastics 1999 Arizona Board of Regents for The University of Arizona
DI water use during rinsing: ~ 103 gallons/wafer ==> ~107 - 108 gallons/year (SEMATECH) Minimal recycle and reuse across the industry Primary objective: CLEAN WAFERS Overview
ON-LINE Resistivity in the Rinse Tank OFF-LINE Particle Counts on Wafer Surface Elemental Analysis of Wafer Surface Device Characteristics Testing Indicators of “Clean Wafers”
Resistivity Primary measurement of ionic concentration of rinse water. The higher the ion concentration, the lower the resistivity. [=] MW - cm Conductivity The inverse of resistivity. For dilute solutions, conductivity is proportional to ionic concentration [=] 1/ (MW - cm) Terminology
Integrated Conductivity The conductivity in the rinse water integrated over the time period required to “recover” from the chemical burden introduced to the system by the wafers Carryover Amount (moles or grams) of chemical “carried over” with the wafers and the boat from chemistry tank to first rinse tank first rinse tank to second rinse tank Terminology (cont’d)
Clean water, high flow conditions (greater than 11 gpm): 17 - 18+ Clean water, low flow conditions: 8-17 or lower Rinse bath containing wafers, immediately following chemistry: <<0.01 (mdl for monitor) “Typical” DI Water Resistivity(MW - cm)
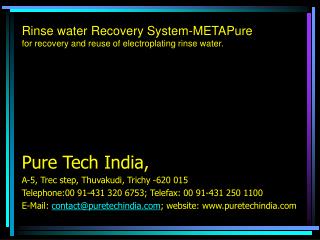
CSTR vs. PFR Model PFR Response CSTR 0 Input For a theoretically pulsed input, the response of a PFR reactor is significantly smaller than that of a CSTR reactor.
Select the methods of reduction Establish “base-line” water requirements for current processes Alter water usage in rinse bath by various means Examine “Indicators” of wafer cleanliness Hypothesis: Wafers can be adequately “cleaned and rinsed” with less water
Pulsed rinse baths HF chemistry Piranha (H2SO4/H2O2) chemistry Decrease in bath volume Methods for DI Reduction
Example Rinse Sequence: SCP 9400 tool Motorola MOS 12 Rinse Rinse Rinse Rinse Rinse Super Q SC1 HF Piranha IPA DRYER
Pulsing ExperimentsHF Chemistry 2 minutes in 10:1 HF 6 minute overflow “first rinse” @ 15 gpm 2 minute overflow “second rinse” @ 15gpm** ** Other chemistry steps with “first rinse” baths could precede this step.
“First Rinse” time: 4, 5, 6 minutes “First Rinse” flow rate: 8 - 15 gpm “Pulsed” flow conditions Period: 10 seconds to 2 minutes High Flow Time: 1 second to 60 seconds Wafer loading: 1 to 50 wafers Experimental VariationsHF Chemistry
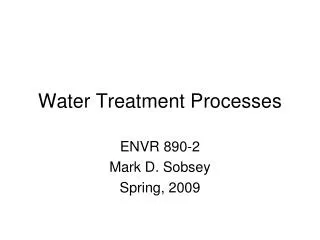
Chemical Carryover ResultsHF Chemistry • Pulsed flow exhibits an improvement over conventional flow in terms of the volume of water employed to obtain the same level of wafer cleanliness.
Pulsing ExperimentsPiranha Chemistry 10 minutes in 7.5:1 H2SO4 / H2O2 at 120 °C 5 “quick-dump rinses (“first rinse”) 3 hot water, 2 cold water High flow for ~1 minute, ~5 second drain, ~30 second refill Flow rate ~ 15 gpm 2 minute overflow “second rinse” @ 15 gpm** ** Other chemistry steps with “first rinse” baths could precede this step.
~ 50 experiments conducted “First Rinse” utilized both quick dump and overflow modes “First Rinse” time 3 - 9 minutes “First Rinse” flow rate 8 - 15 gpm “Pulsed” Flow conditions period: 10 seconds to 4 minutes high flow time: 2 seconds to 2 minutes Hot and Cold Rinses “Agitation” (using robot arm) Experimental VariationsPiranha Chemistry
Effect of Pulse “Sequence” • “’On’ first” provides a marginally more effective rinse due to the occurrence of convection before diffusion.
Effect of Temperature and Agitation Hot rinses and cold rinses with agitation reduce the amount of carryover associated with a standard cold rinse. This is possibly due to an increased rate at which chemical contaminants are swept from the wafer surface.
Comparison:Carryover to Surface LoadingPiranha Chemistry “ Clean” Carryover: 0.01 mg H2SO4 ==> 10-7 moles Surface Measurements by XRF: 1013 molecules S/cm2 For 50 200mm wafers ==> 10-7 moles
Comparison of Rinse Tank Performance HF Chemistry, Bare Wafers The lower volume tank exhibits an improvement over the standard tank in rinsing bare Si wafers.
Comparison of Rinse Tank Performance HF Chemistry, Oxide Wafers For oxide wafers, no significant difference is seen between the standard and Dynaflow tanks.
Summary • Under certain conditions, pulsing has a pronounced effect on rinse efficiency. • Combining pulsing sparingly with quick-dumps (in those processes which allow for quick-dumps) can further increase rinse efficiency. • A substantial portion of the time during rinsing is spent “cleaning up the water” rather than cleaning up the wafer surface. • Moving the characteristic operating conditions of the rinse tank closer to Plug flow conditions can potentially reduce water usage over that required for CSTR conditions. • A new rinse bath shape using less water volume can decrease water usage while achieving an effective rinse for bare silicon wafers.