Download
1 / 9
120 likes | 236 Views
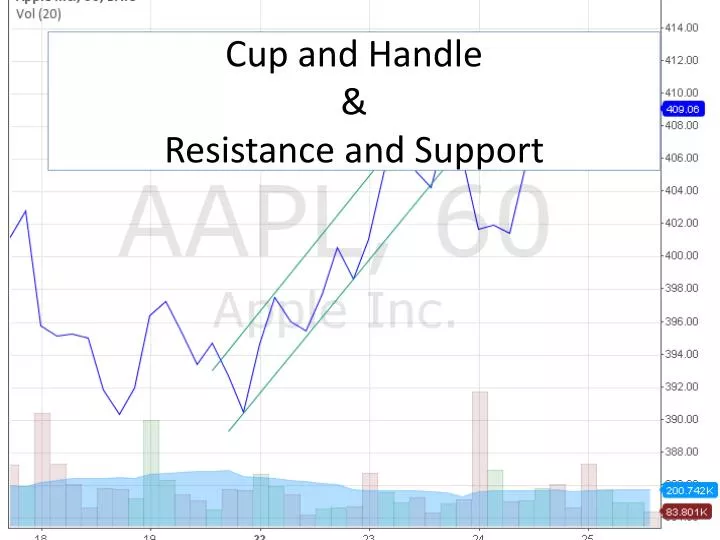
Cup and Handle & Resistance and Support. Cup and Handle. Is a bullish chart pattern that is defined by a chart where a stock drops in value, then rises back up to the original value, then drops a small amount in value, and then rises a small amount in value.

E N D
Cup and Handle Is a bullish chart pattern that is defined by a chart where a stock drops in value, then rises back up to the original value, then drops a small amount in value, and then rises a small amount in value. A cup and handle pattern is an indicator that you should be buying that stock or buying call options
Support • A support level is a price level where the price tends to find support as it is going down. This means the price is more likely to "bounce" off this level rather than break through it. However, once the price has passed this level, it is likely to continue dropping until it finds another support level. Support Line
Resistance Resistance Line • A resistance level is the opposite of a support level. It is where the price tends to find resistance as it is going up. This means the price is more likely to "bounce" off this level rather than break through it. However, once the price has passed this level, it is likely that it will continue rising until it finds another resistance level.
Support and Resistance Resistance and support lines do not have to be horizontal, they can have a positive or negative slope Resistance Line Broken through support significantly, it’s a time to sell or short sell, or buy put options Support Line
Resistance Line Broken through resistance significantly, buy stock or call options Support Line
Chart Pattern Portfolio • Create a PowerPoint portfolio of examples of all of the different stock patterns you have learned. • Each example: • Explain what pattern it is and why. • Label each example (Head and Shoulders, Support and resistance, and cup and handle) • Describe what investment advice you would give to someone who observed this trend as it was happening?
Chart Pattern Portfolio • Long Body Candlestick (one of each) (Empty and Filled) • Hammer • Hanging Man • Inverted Hanging Man • Shooting Star • Head and Shoulders • Inverted Head and Shoulders • Cup and Handle • Support and Resistance – Support Break Through • Support and Resistance – Resistance Break Through
Inverted Hammer - Example Explanation: I know its an inverted hammer, because it has an empty body (Positive daily movement) ,a large upper shadow, and it is at the bottom of a trough on April 21st. Investment advice: The price should increase after an inverted hammer, so I would suggest buying stocks or call options. Inverted Hammer