Download

1 / 44
440 likes | 545 Views
Inference of cis and trans regulatory variation in the human genome. Manolis Dermitzakis The Wellcome Trust Sanger Institute Wellcome Trust Genome Campus Cambridge, UK md4@sanger.ac.uk. Gene expression. Altered patterns of gene expression disease .

E N D
Inference of cis and trans regulatory variation in the human genome Manolis Dermitzakis The Wellcome Trust Sanger Institute Wellcome Trust Genome Campus Cambridge, UK md4@sanger.ac.uk
Gene expression • Altered patterns of gene expression disease. • e.g., Type 1 diabetes, Burkitt’s lymphomas. • Widespread intraspecific variation. • Heritable genetic variation for transcript levels. • Familial aggregation of expression profiles (Cheung et al. 2003). • In humans, ~30% of surveyed loci exhibited a genetic component for expression differences (Monks et al. 2004; Schadt et al. 2003). • Much of the influential variation is located cis- to the coding locus. • In humans, mouse, and maize, 35%-50% of the genetic basis for intraspecific differences in transcription level are cis- to the coding locus (e.g. Morley et al. 2004; Schadt et al. 2003; Stranger et al. 2005; Cheung et al. 2005, etc.).
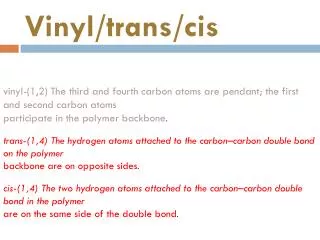
GENE REG DNA i) Pre-mRNA ii) mRNA iii) Protein GENE REG iv) DNA Nature of regulatory variation Expression Stranger and Dermitzakis, Human Genomics 2005
Effects of Copy Number Variation on gene expression
Gene expression association mapping AA AG GG Stranger et al. PLoS Genet 2005
Cell line RNA IVT1 IVT2 rep2 rep3 rep1 rep4 Whole-genome gene expression • ~48,000 transcripts • 24,000 RefSeq • 24,000 other transcripts • 270 HapMap individuals: • CEU: 30 trios, 90 total • CHB: 45 unrelated • JPT: 45 unrelated • YRI: 30 trios, 90 total • 2 IVTs each person • 2 replicate hybridizations each IVT • Quantile normalization of all replicates of each individual. • Median normalization across all individuals of a population.
Within- and between- individual variation 2 replicates; single YRI individual r2 (all genes) = 0.990 Detected genes (0.98 in both samples: 12,076) r2 (detected) = 0.994 2 YRI individuals r2 (all genes) = 0.964 Detected genes (0.98 in both samples: 11,529) r2 (detected) = 0.964
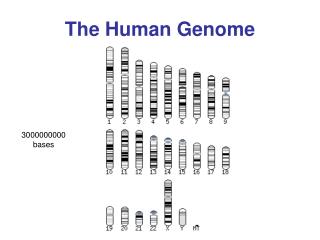
14,925 genes Phase I HapMap; MAF > 0.05 CEU: 762,447 SNPs CHB: 695,601 JPT: 689,295 YRI: 799,242 ~1/5kb HapMap SNPs 60 CEU 45 CHB 44 JPT 60 YRI
Copy Number Variation dataset • Genome Structural Variation Consortium • Redon et al. Nature in press • Array-CGH using a whole genome tile path array • Median clone size ~170 kb • All 270 HapMap individuals • Quantitative values (log2 ratios) representing diploid genome copy number, not genotypes. • 1117 CNVs called from log2 ratios • Calls based on standard deviation of log2 ratios • Many CNVs experimentally verified 26,563 clones 93.7% euchromatic genome
SNP cis-analysis: SNPs within 1Mb of probe midpoint 1Mb 1Mb 1Mb window probe gene SNPs
Association analysis Additive association model: Linear regression e.g. CC = 0, CT = 1, TT = 2. - slope of line - p-value - r2 0 1 2
CNV cis-analysis: clone midpoint within 2Mb of probe midpoint 2Mb 2Mb 1Mb window probe gene clones
Linear regression for CNV and expression Clone signal (log2 ratio)
Multiple-test correction whole-genome 1. Bonferroni cis- whole-genome 2. False Discovery Rate FDR cis- whole-genome permutations 3. cis-
Permutation design GENOTYPES GENE EXPRESSION g11 g12 g13 g14 … g1n g21 g22 g23 g24 … g2n g31 g32 g33 g34 … g3n … … … gi1 gi2 gi3 gi4 … gin Exp1 Exp2 Exp3 … … … Expi permute - 10,000 permutations – each time keep lowest p-value - Null distribution of 10,000 extreme p-values - Compare observed p-values to the tails of the null
Significant expression – cis-SNP associations • CEU genes 323 • CHB genes 348 • JPT genes 370 • YRI genes 411 • 888 non-redundant genes • 67 genes in all 4 populations (8%) • 333 genes in at least 2 populations (37%) ~ 6% genes exhibit significant cis- association permutation threshold 0.001; SNP-probe distance < 1Mb
Significant expression – cis-CNV clones associations • CEU genes 40 • CHB genes 32 • JPT genes 40 • YRI genes 42 • 99 non-redundant genes • 7 genes associated in all 4 populations (7%) • 34 genes in at least 2 populations (34%) permutation threshold 0.001; clone-probe distance < 2Mb
Some genes ABC1, ABHD6, ACY1L2, ADAT1, ARNT, ARSA, ASAHL, ATP13A, B7, BBS2, BLK, C14orf130, C14orf4, C14orf52, C1orf16, C20orf22, C21orf107, C7orf13, C7orf29, C7orf31, C8orf13, C9orf95, CARD8, CAT, CD151, CD79B, CDKN1A, CDKN2B, CGI-111, CGI-62, CGI-96, CHCHD2, CHI3L2, CHRNE, CNN2, CP110, CPEB4, CPNE1, CRIPT, CSTB, CTNS, CTSH, CTSK, DCLRE1B, DCTD, DERP6, dJ383J4.3, DKFZp434N035, DKFZP566H073, DKFZP566J2046, DKFZP586D0919, DKFZp761A132, DNAJD1, DOM3Z, DPYSL4, DSCR5, DTNB, ECHDC3, EGFL5, EIF2B2, ENTPD1, ERMAP, FCGR2A, FDX1, FKBP1A, FLJ10252, FLJ10904, FLJ12994, FLJ12998, FLJ13576, FLJ14009, FLJ14753, FLJ20444, FLJ20635, FLJ21347, FLJ21616, FLJ22374, FLJ22573, FLJ22635, FLJ23235, FLJ34443, FLJ35827, FLJ36888, FLJ37970, FLJ40432, FLJ46603, FLJ90036, FUT10, GAA, GSTM1, GSTM2, GSTT1, H17, HABP4, HIBCH, HLA-C, HLA-DQA1, HLA-DQA2, hmm1412, hmm23621, hmm26268, hmm31752, hmm31999, hmm3577, hmm3587, hmm5445, hmm665, hmm8232, HNLF, Hs.119946, Hs.124623, Hs.135624, Hs.153573, Hs.158943, Hs.164463, Hs.169006, Hs.171169, Hs.212658, Hs.245997, Hs.26039, Hs.264076, Hs.311977, Hs.333841, Hs.379903, Hs.396207, Hs.400876, Hs.40696, Hs.431200, Hs.43687, Hs.453941, Hs.460359, Hs.465789, Hs.466924, Hs.467281, Hs.482037, Hs.485895, Hs.490095, Hs.495422, Hs.506072, Hs.517172, Hs.519979, Hs.5855, Hs.6637, HSRTSBETA, IFIT5, IL16, IL21R, IMAGE3451454, IMMT, IPP, IREB2, IRF5, KIAA0265, KIAA0483, KIAA0643, KIAA0748, KIAA1463, KIAA1627, LCMT1, LOC113386, LOC132001, LOC132321, LOC135043, LOC151963, LOC282956, LOC283710, LOC283970, LOC284184, LOC284293, LOC285407, LOC286353, LOC339231, LOC339803, LOC339804, LOC340435, LOC347981, LOC348094, LOC348180, LOC374758, LOC375097, LOC375399, LOC378075, LOC388918, LOC389362, LOC389763, LOC399987, LOC400410, LOC400566, LOC400642, LOC400684, LOC400933, LOC401075, LOC401135, LOC401284, LOC51240, LOC90637, LOC90693, MAN1A2, MCMDC1, MGC10120, MGC12458, MGC13186, MGC19764, MGC20235, MGC20481, MGC20781, MGC22773, MGC24665, MGC2752, MGC3794, MGC9084, MMRP19, MRPL21, MRPL43, MTERF, MYOM2, NDUFA10, NDUFS5, NMNAT3, NUDT2, OAS1, PACSIN2, PASK, PBX4, PCTAIRE2BP, PEX5, PEX6, PGS1, PHACS, PHC2, PHEMX, PIP5K1C, PIP5K2A, PKHD1L1, POLR2J, PP3856, PP784, PPA2, PPFIA1, PPIL3, PTER, QRSL1, R29124_1, RABEP1, RAPGEFL1, RDH5, RPAP1, RPL13, RPL36AL, RPL8, RPLP2, RPS16, RPS6KB2, SARS2, SERPINB10, SF1, SH3GLB2, SHMT1, SIAT4C, SIVA, SKIV2L, SNAP29, SNX11, SOD2, SPG7, SQSTM1, ST7L, STAT6, STK25, SYNGR1, SYNGR3, TAP2, TAPBP-R, TBC1D4, TCL6, TEF, TGM5, THAP5, THAP6, THOC3, TIMM10, TINP1, TMEM8, TMPIT, TRAPPC4, TRIM4, TSGA10, TSGA2, TUBB, UBE2G1, UGT2B11, UGT2B17, UGT2B7, UROS, USMG5, VPS28, WARS2, WBSCR27, WWOX, XRRA1, ZNF266, ZNF384, ZNF493, ZNF587, ZNF79, ZNF85, ZRANB1, • UGT2B7, 11, 17 • GSTM1
Genomic location of associations SNP CNV
SNPs CNVs
Effects of Copy Number Variation on gene expression POSITIVE POSITIVE OR NEGATIVE NEGATIVE POSITIVE OR NEGATIVE
Negative or positive slope in CNV associations 80% positive 20% negative
What is the overlap between SNP and CNV effects? Do SNPs capture the CNV effects through Linkage Disequilibrium?
LD between CNV and SNP Gene X Gene X A 2x expression A A Gene X G G 1x expression G
CNVs and SNPs mostly capture different effects • Relative impact on gene expression: 82% SNPs 18% CNVs • Only 13% of genes with CNV association also had a SNP association in the same population • biased toward large effect size. • CNV and SNP variation are highly correlated (p-value 0.001). • Lack of overlapping effects is not due to CNVs in regions of segmental duplications (few HapMap SNPs). • Percentage of associated clones overlapping SDs does not differ from all clones overlapping SDs (p-value: 0.016). • Also, the probability that a CNV signal is captured by SNPs does not depend on whether the CNV is in a SD (17.3%) or outside of SDs (15.9%).
Direction of allelic effect POP2 POP1 AGREEMENT OPPOSITE
Direction of allelic effects 95% have the same direction
Trans effects mirnaSNPs spliceSNPs rSNPs nsSNPs GENE REG DNA Genome-wide associations Dissect regulatory networks
Regulatory variants have the highest impact on regulatory networks
Conclusions • Large number of genes with significant expression variation within and between human population samples and strong association between individual genes and specific SNPs and CNVs. • Little overlap between SNP and CNV signals • Replication of significant signals across populations. • Promising approach for identification of functionally variable regulatory regions. • Cis regulatory variation mostly responsible for genome-wide regulatory variation
Acknowledgements Cambridge University Mark Dunning Simon Tavaré Barbara Stranger Matthew Forrest Catherine Ingle Antigone Dimas Christine Bird Alexandra Nica Claude Beazley Panos Deloukas Cornell University Andy Clark illumina Jill Orwick Mark Gibbs Genome Structural Variation Consortium Matt Hurles, Richard Redon, Nigel Carter, Charles Lee, Chris Tyler-Smith, Stephen Scherer, The HapMap Consortium Wellcome Trust for funding
Wellcome Trust Advanced Courses Working with the HapMap 2-5 April 2007 Closing date for applications: 10 January 2007 Wellcome Trust Genome Campus, Hinxton, Cambridge This 4-day residential workshop will provide a comprehensive overview of the International HapMap Project, including practical experience of working with the HapMap data to map phenotypic traits to locations in the human genome. Theoretical lectures will be combined with hands-on practical sessions and introduction to relevant databases and tools. Course instructors: Paul de Bakker (MIT), Manolis Dermitzakis (Sanger Institute), Mike Feolo (NIH/NCBI), Jonathan Marchini (Oxford University), Gil McVean (Oxford University), Steve Sherry (NIH/NCBI), Albert Vernon Smith (CSHL), Barbara Stranger (Sanger Institute), Eleftheria Zeggini (Wellcome Trust Center for Human Genetics) Speakers: Lon Cardon (Wellcome Trust Center for Human Genetics), Panos Deloukas (Sanger Institute), John Todd (Cambridge University) Full information and application details at: www.wellcome.ac.uk/advancedcourses