Download
1 / 29
290 likes | 379 Views
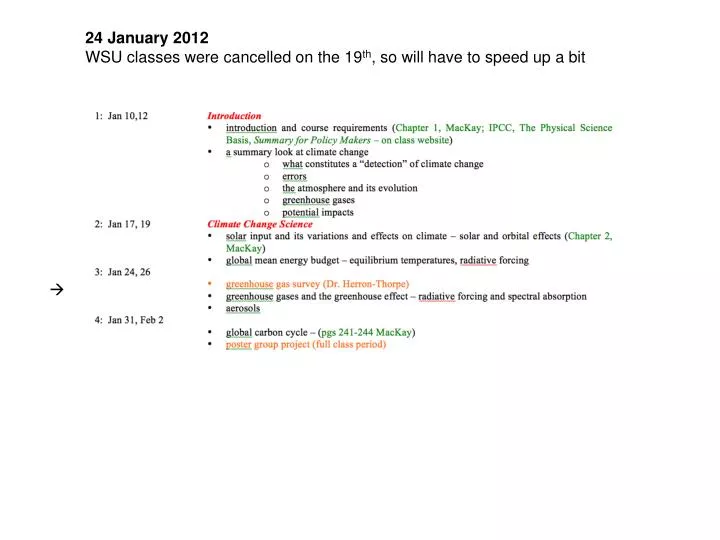
24 January 2012 WSU classes were cancelled on the 19 th , so will have to speed up a bit. . any questions from last Tuesday [WSU cancelled classes on Thursday]? Earth radiation budget, GHG spectra, and aerosols HWs 2 & 3 are due today HW 4 is posted on the web – due Tuesday 1/31/2012

E N D
24 January 2012 WSU classes were cancelled on the 19th, so will have to speed up a bit
any questions from last Tuesday [WSU cancelled classes on Thursday]? Earth radiation budget, GHG spectra, and aerosols HWs 2 & 3 are due today HW 4 is posted on the web – due Tuesday 1/31/2012 solutions to HW 2 and HW 3 will be on the web today – no late papers accepted
HW 2 on Mauna Loa data quick guess at annual change per year: [390 – 310] / [2011-1958] = 1.5 ppm/yr which is approximately [1.5ppm/350ppm] *100 = 0.43%/yr but the question asks you to graph annual change for each year
notice there is an increase in emissions with time, not subtle – have nearly tripled and the calculations does not have to feret out a subtle feature in the data. It is very clear and without dispute!
astronomical forces drive global climate change – natural change • seasons are driven by astronomical causes, as is the 24 h day/night cycle
not until the second half of 19th century was it accepted that there were indeed ice ages • three main types of evidence that climate has radically changed in the past • geological • rock scouring • moraines from glaciers • valley cutting • glacial erratics • chemical • isotope ratios in fossils and ice cores • paleontological • fossil geographic distributions • have been at least 5 major ice ages • Earth has been in an interglacial period for • about 11000 yrs – very stable climate • causes of the ice ages are not understood in detail • atmospheric composition • changes in Earth orbit that are cyclic • motion of tectonic plates changed winds, ocean currents, etc. • changes in solar irradiance
Earth orbital changes that vary the solar input and cause the ice ages: the Milankovich cycles – these cycles change the solar input to the Earth system
eccentricity changes varies from nearly circular to high eccentricity 0.058 with mean 0.028. Caused by perturbations from the other planets e = 0.017 currently shape of earth’s orbit changes during a cycle of about 100,000 years
axial tilt (obliquity) – increased obliquity increased seasonal amplitude change axis of rotation changes from about 21.5° to 24.5° --> seasonal variations over a period of 41,000 years. Tilt is the most significant cause of seasonal temp change. Modulates the seasons
axial precession – trend in direction of axis of rotation in inertial space – gyroscopic motion the earth’s rotation axis precesses (wobbles) with a period of about 26,000 years due to tidal forces exerted by sun and moon on solid Earth since Earth is not spherical affects climate extremes
problems with the Milankovitch theory for ice ages: • 100,000 yr problem: eccentricity variations should have a smaller impact than the other mechanisms, but this is the strongest climate signal in the data record • 400,000 yr problem: eccentricity variations also show a 400,000 yr cycle but that cycle is only visible in climate records > 1My ago • observations of climate changes show behavior much more intense than calculated • the 23,000 yr cycle dominates, the opposite of what is observed • the “reinforcement of causes” does not seem strong enough to initiate an ice age • in the past 400k yrs, Milankovitch cycles match too well to ignore • so the explanation is not 100% - there are still issues with the explanation
radiative forcing: IPCC “Radiative forcing is a measure of the influence a factor has in altering the balance of incoming and outgoing energy in the Earth-atmosphere system and is an index of the importance of the factor as a potential climate change mechanism. In this report radiative forcing values are for changes relative to preindustrial conditions defined at 1750 and are expressed in watts per square meter (W/m2)” RF can be used to estimate a subsequent change in equilibrium temperature (DT) since temperature must be related to change in radiation (linear or ??): DT = lDF where DF is the radiative forcing (W m-2), and lis called the mean climate sensitivity factor [°C/(W m-2)] and allows computation of impacts on temperature of different GHG different atmospheric models different values of l RF for CO2, l = 0.71 °C/W m-2 for a 1°C atmospheric temperature change, DF = 1.41 W m-2
factors that influence the radiative equilibrium of the Earth system average solar input: 342 w/m2 source IPCC 2007
global warming potential (GWP) of a gas [GWPg]: a weighting factor to compare the GHG efficiency of a gas relative to CO2. Compares potency of GHG to that of CO2: GWPg = Fg x Rg(t) dt / FCO2 x RCO2 dt where the integral is from time 0 to time T Fg = radiative forcing efficiency of the gas in question [w m-2 kg-1] FCO2 = radiative forcing efficiency of CO2 [w m-2 kg-1] Rg = fraction of the 1 kg of gas remaining in the atmosphere at time t RCO2 = fraction of the 1 kg of CO2 remaining in the atmosphere at time t radiative forcing efficiency is usually an exponential decay function, or ~ constant with time, depending on the gas. For CO2 the decay is rapid the first few decades as the biosphere absorbs the carbon, then it decays at a much slower rate corresponding to the slow CO2 uptake of the oceans Choice of time horizon for GWP depends on what a policy maker is interested in e.g. CH4 GWP is 62 for 20 yr horizon, 23 for 100 yr, and 7 for 500 yr
compare CO2 to CH4 and N2O emissions for warming potential: emissions: CO2 = 27,000 MMt CO2/yr US emissions CH4 = 370 MMtCH4/yr N2O = 6 MMt N2O/yr [MMt = million metric tons] compare impacts to CO2: CH4: GWP100 = 23*370 = 8510 MMtCO2 equivalent N2O: GWP100 = 296*6 = 1776 MMtCO2 equivalent
GHG sources and sinks sources and sinks, top right 1990 and 2000 levels
measured thermal Earth radiation over the Mediterranean sea H2O CO2 O3 H2O CH4 N2O thermal radiation curves (T) GHG absorbers are indicated with atmospheric transmission “windows”
radiation of the Earth at equilibrium effective temperature of 288K = +15°C peak of the radiation curve at about 15 µm this curve is the Planck curve for a black body at 288K