Download
1 / 15
150 likes | 275 Views
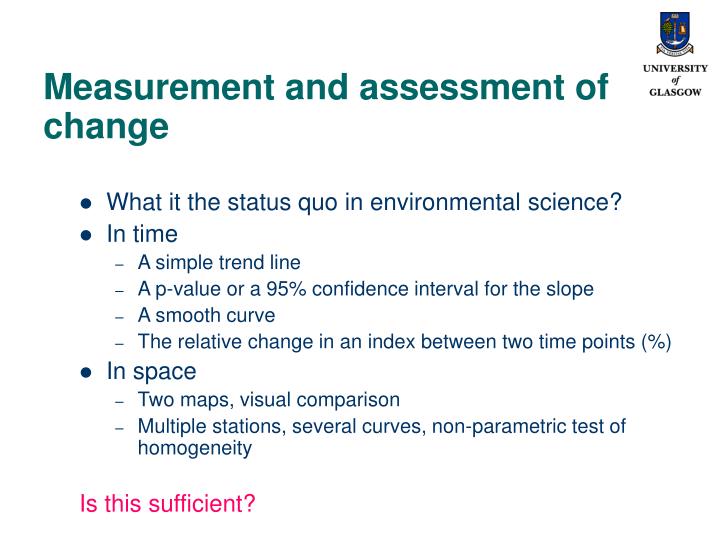
Measurement and assessment of change. What it the status quo in environmental science? In time A simple trend line A p-value or a 95% confidence interval for the slope A smooth curve The relative change in an index between two time points (%) In space Two maps, visual comparison

E N D
Measurement and assessment of change • What it the status quo in environmental science? • In time • A simple trend line • A p-value or a 95% confidence interval for the slope • A smooth curve • The relative change in an index between two time points (%) • In space • Two maps, visual comparison • Multiple stations, several curves, non-parametric test of homogeneity Is this sufficient?
Measurement and assessment of change • In time (SNIFFER, 2006) • A linear regression equation was calculated for each dataset and then the trend was calculated from the gradient parameter (i.e. the rate of change) multiplied by the length of the data period to provide a clear change value since the start of the period. • “the significance of trends was tested using the non-parametric Mann-Kendall tau test (Sneyers, 1990). Linear trends with the Mann-Kendall significance test are widely used in the analysis of climate trends” Is this sufficient?
Joint Nature Conservation Council definition of trend • a trend is a measurement of change derived from a comparison of the results of two or more statistics. • A trend relates to a range of dates spanning the statistics from which it is derived, e.g. 1996 - 2000. A trend will generally be expressed as a percentage change (+ for an increase, - for a decrease) or as an index.
Statistical definition of trend • What is a statistical trend? • A long-term change in the mean level (Chatfield, 1996) • Long-term movement (Kendall and Ord, 1990) • The non-random function (t)= E (Y(t)) (Diggle, 1990) • Trend is a long-term behaviour of the process, trends in mean, variance and extremes may be of interest (Chandler, 2002) • Environmental change often but not always means a statistical trend • Not restricted to linear (or even monotonic) trends
Statistical tools for exploring and quantifying trend • Exploratory tools • Time series plots, smoothed trends over time (are the series equally spaced, no missing data?) • More formal tools • Can you assume monotonicity?, is the trend linear? • Non-parametric estimation and testing (classic tests) • Semi-parametric and non-parametric additive models (for irregular spaced data) • Space and time together
Mann Kendall test for monotonic trend The test statistic is S = sgn(xj-xk) Where sgn(xj-xk) = 1 if xj-xk>0 = 0 if xj-xk=0 = -1 if xj-xk<0 The slope estimate usually provided using the Sen estimator Seasonal adjustment a generalisation of the Mann Kendall test: the Mann Kendall test statistic is evaluated in each season separately, and then summed. Adjustment for covariates also possible The Mann Kendall family
Alternative statistical tools(for long, irregular time series, which may be non-monotonic) • Parametric and semi-parametric models, • non-parametric additive models • Extensions to spatio-temporal modelling • Tools for inference
Measurement and assessment of change-three questions to consider • Is routine monitoring data useful/adequate/sufficient for environmental change detection? • Are the classical (well accepted) simple procedures such as • the % change between two time points (the slope), • A p-value or a 95% confidence interval for the slope sufficient for the complexity of environmental behaviour? • What do ‘statistical trends’ offer to evaluation of environmental change, to management and to policy setting?
Statistical trends and environmental change • Sophisticated statistical models for trends can give • added value to routine monitoring data, • better descriptions of complex change behaviour and • begin to tease out climate change driven effects in environmental quality
Scottish Environmental Statistics • Collection of data, primarily from other sources, but published by the Scottish Executive • Digest published annually, with associated web-site updated more frequently • Choice of statistics subject to comment by an advisory committee of civil servants and external representatives