Download

1 / 15
160 likes | 415 Views
Turbidity. Walker D. Wright-Moore Chem 576 12/1/09. What Is Turbidity?. Turbidity is a key measure of water quality and clarity. Turbidity is the cloudiness or haziness in the water due to suspended solids. Causes: Land disruption Effluent discharge Mineral runoff Heavy rains

E N D
Turbidity Walker D. Wright-Moore Chem 576 12/1/09
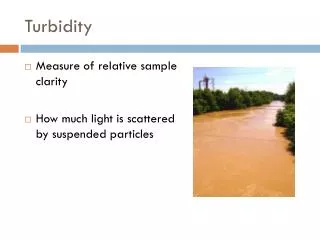
What Is Turbidity? • Turbidity is a key measure of water quality and clarity. • Turbidity is the cloudiness or haziness in the water due to suspended solids. • Causes: • Land disruption • Effluent discharge • Mineral runoff • Heavy rains • Algae blooms http://en.wikipedia.org/wiki/Turbidity
Why Measure Turbidity? • Very important for water treatment. • High turbidity levels have been linked to high levels of viruses and bacteria. • NC state levels are 50 NTU for fresh water and 25 NTU for tidal saltwater (http://www.epa.gov/safewater/) • High turbidity can limit the amount of light penetration in the water column: • Effects photosynthesis- low oxygen levels • Sight feeding fish
How We Measure Turbidity: • Methods: Secchi disc and nephelometers. • Nephelometers: • Standards must be used to calibrate the instrument. • A source beam is passed through the water sample and a detector measures the light scattered or reflected. • Amount of scattering is proportional to turbidity. • Units used in the United States are Nephelometric Turbidity Untis (NTU). Also seen as FTU.
*Red line: Daily Average Discharge is calculated based on the discharge data collected since 1969-09-01 http://www.cormp.org
Salinity vs Turbidity Cruise 1 Cruise 2
Cruise 2:Turbidity vsKd *Ignore trendline*
Conclusions: • River discharge could be an indicator of turbidity. • Cape fear river discharge in September, cruise 1, was slightly higher than October, cruise 2, and both were lower than the past lcfrp average data for those months except surface turbidity at M23 and M35. • Cruise 1 and 2 surface turbidity showed little correlation with changing salinity, but turbidity did seem to increase with decreasing salinity in the deep water samples. • It is possible that deep turbidity values could get skewed due to the sampling equipment hitting the bottom and re-suspending bottom material • Increasing turbidity should correlate with increasing Kd, and maybe some correlation to this affect can be seen. Kd is also influenced by DOC.