Download
1 / 1
10 likes | 126 Views
References. Table 1. Variable sites encompassed, and base composition for the short simulated regions studied and the near full-length fragment Percentage of V (variable), HV (highly variable), and C (conserved) bases. NFL: Near full-length sequences.

E N D
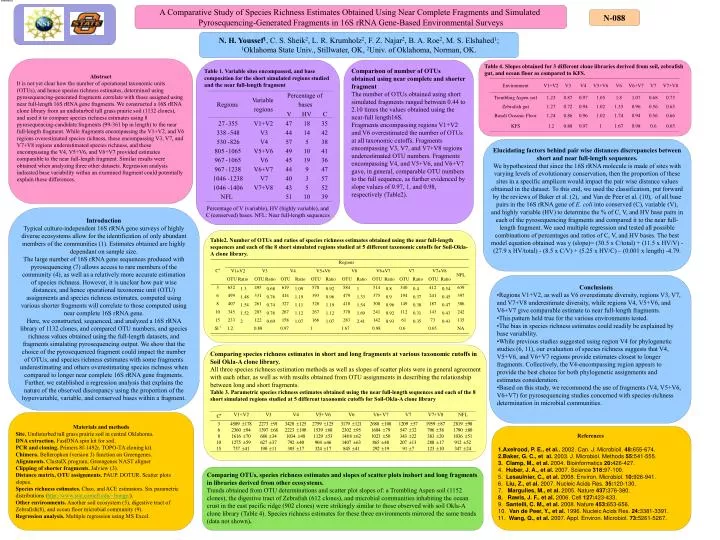
References Table 1. Variable sites encompassed, and base composition for the short simulated regions studied and the near full-length fragment Percentage of V (variable), HV (highly variable), and C (conserved) bases. NFL: Near full-length sequences Table2. Number of OTUs and ratios of species richness estimates obtained using the near full-length sequences and each of the 8 short simulated regions studied at 5 different taxonomic cutoffs for Soil-Okla-A clone library. Comparing species richness estimates in short and long fragments at various taxonomic cutoffs in Soil Okla-A clone library. All three species richness estimation methods as well as slopes of scatter plots were in general agreement with each other, as well as with results obtained from OTU assignments in describing the relationship between long and short fragments. Table 3. Parametric species richness estimates obtained using the near full-length sequences and each of the 8 short simulated regions studied at 5 different taxonomic cutoffs for Soil-Okla-A clone library Percentage of Variable Regions bases regions V HV C 27 - 355 V1+V2 47 18 35 338 - 548 V3 44 14 42 530 - 826 V4 57 5 38 805 - 1065 V5+V6 49 10 41 967 - 1065 V6 45 19 36 967 - 1238 V6+V7 44 9 47 1046 - 1238 V7 40 3 57 1046 - 1406 V7+V8 43 5 52 NFL 51 10 39 A Comparative Study of Species Richness Estimates Obtained Using Near Complete Fragments and Simulated Pyrosequencing-Generated Fragments in 16S rRNA Gene-Based Environmental Surveys N-088 N. H. Youssef1, C. S. Sheik2, L. R. Krumholz2, F. Z. Najar2, B. A. Roe2, M. S. Elshahed1; 1Oklahoma State Univ., Stillwater, OK, 2Univ. of Oklahoma, Norman, OK. Abstract It is not yet clear how the number of operational taxonomic units (OTUs), and hence species richness estimates, determined using pyrosequencing-generated fragments correlate with those assigned using near full-length 16S rRNA gene fragments. We constructed a 16S rRNA clone library from an undisturbed tall grass prairie soil (1132 clones), and used it to compare species richness estimates using 8 pyrosequencing-candidate fragments (99-361 bp in length) to the near full-length fragment. While fragments encompassing the V1+V2, and V6 regions overestimated species richness, those encompassing V3, V7, and V7+V8 regions underestimated species richness, and those encompassing the V4, V5+V6, and V6+V7 provided estimates comparable to the near full-length fragment. Similar results were obtained when analyzing three other datasets. Regression analysis indicated base variability within an examined fragment could potentially explain those differences. Comparison of number of OTUs obtained using near complete and shorter fragment The number of OTUs obtained using short simulated fragments ranged between 0.44 to 2.10 times the values obtained using the near-full length16S. Fragments encompassing regions V1+V2 and V6 overestimated the number of OTUs at all taxonomic cutoffs. Fragments encompassing V3, V7, and V7+V8 regions underestimated OTU numbers. Fragments encompassing V4, and V5+V6, and V6+V7 gave, in general, comparable OTU numbers to the full sequence, as further evidenced by slope values of 0.97, 1, and 0.98, respectively (Table2). Table 4. Slopes obtained for 3 different clone libraries derived from soil, zebrafish gut, and ocean floor as compared to KFS. Elucidating factors behind pair wise distances discrepancies between short and near full-length sequences. We hypothesized that since the 16S rRNA molecule is made of sites with varying levels of evolutionary conservation, then the proportion of these sites in a specific amplicon would impact the pair wise distance values obtained in the dataset. To this end, we used the classification, put forward by the reviews of Baker et al. (2), and Van de Peer et al. (10), of all base pairs in the 16S rRNA gene of E.coli into conserved (C), variable (V), and highly variable (HV) to determine the % of C, V, and HV base pairs in each of the pyrosequencing fragments and compared it to the near full-length fragment. We used multiple regression and tested all possible combinations of percentages and ratios of C, V, and HV bases. The best model equation obtained was y (slope)= (30.5 x C/total) + (11.5 x HV/V) - (27.9 x HV/total) - (8.5 x C/V) + (5.25 x HV/C) – (0.001 x length) -4.79. Introduction Typical culture-independent 16S rRNA gene surveys of highly diverse ecosystems allow for the identification of only abundant members of the communities (1). Estimates obtained are highly dependant on sample size. The large number of 16S rRNA gene sequences produced with pyrosequencing (7) allows access to rare members of the community (4), as well as a relatively more accurate estimation of species richness. However, it is unclear how pair wise distances, and hence operational taxonomic unit (OTU) assignments and species richness estimates, computed using various shorter fragments will correlate to those computed using near complete 16S rRNA gene. Here, we constructed, sequenced, and analyzed a 16S rRNA library of 1132 clones, and compared OTU numbers, and species richness values obtained using the full-length datasets, and fragments simulating pyrosequencing output. We show that the choice of the pyrosequenced fragment could impact the number of OTUs, and species richness estimates with some fragments underestimating and others overestimating species richness when compared to longer near complete 16S rRNA gene fragments. Further, we established a regression analysis that explains the nature of the observed discrepancy using the proportion of the hypervariable, variable, and conserved bases within a fragment. • Conclusions • Regions V1+V2, as well as V6 overestimate diversity, regions V3, V7, and V7+V8 underestimate diversity, while regions V4, V5+V6, and V6+V7 give comparable estimate to near full-length fragments. • This pattern held true for the various environments tested. • The bias in species richness estimates could readily be explained by base variability. • While previous studies suggested using region V4 for phylogenetic studies (6, 11), our evaluation of species richness suggests that V4, V5+V6, and V6+V7 regions provide estimates closest to longer fragments. Collectively, the V4-encompassing region appears to provide the best choice for both phylogenetic assignments and estimates consideration. • Based on this study, we recommend the use of fragments (V4, V5+V6, V6+V7) for pyrosequencing studies concerned with species-richness determination in microbial communities. Materials and methods Site. Undisturbed tall grass prairie soil in central Oklahoma. DNA extraction. FastDNA spin kit for soil. PCR and cloning. Primers 8f-1492r. TOPO-TA cloning kit. Chimera. Bellerophon (version 3) function on Greengenes. Alignments. ClustalX program, Greengenes NAST aligner Clipping of shorter fragments. Jalview (3). Distance matrix, OTU assignments. PAUP. DOTUR. Scatter plots slopes. Species richness estimates. Chao, and ACE estimators. Six parametric distributions (http://www.stat.cornell.edu/~bunge/). Other environments. Another soil ecosystem (5), digestive tract of Zebrafish(8), and ocean floor microbial community (9). Regression analysis. Multiple regression using MS Excel. • References • Axelrood, P. E., et al.. 2002. Can. J. Microbioil. 48:655-674. • Baker, G. C., et al. 2003. J. Microbiol. Methods 55:541-555. • 3. Clamp, M., et al. 2004. Bioinformatics 20:426-427. • 4. Huber, J. A., et al. 2007. Science 318:97-100. • 5. Lesaulnier, C., et al. 2008. Environ. Microbiol. 10:926-941. • 6. Liu, Z., et al. 2007. Nucleic Acids Res. 35:120-130. • 7. Margulies, M., et al. 2005. Nature 437:376-380. • 8. Rawls, J. F., et al. 2006. Cell 127:423-433. • 9. Santelli, C. M., et al. 2008. Nature 453:653-656. • 10. Van de Peer, Y., et al. 1996. Nucleic Acids Res. 24:3381-3391. • 11. Wang, Q., et al. 2007. Appl. Environ. Microbiol. 73:5261-5267. Comparing OTUs, species richness estimates and slopes of scatter plots inshort and long fragments in libraries derived from other ecosystems. Trends obtained from OTU determinations and scatter plot slopes of: a Trembling Aspen soil (1152 clones), the digestive tract of Zebrafish (612 clones), and microbial communities inhabiting the ocean crust in the east pacific ridge (902 clones) were strikingly similar to those observed with soil Okla-A clone library (Table 4). Species richness estimates for these three environments mirrored the same trends (data not shown).