Download
1 / 53
540 likes | 781 Views
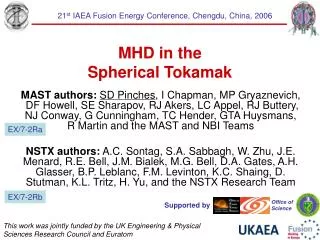
HT-7. ASIPP. Direct Measurement of Long Poloidal Wavelength E B Flows in the HT-7 Tokamak. G.S.Xu* , B.N.Wan , M.Song , J.Li Institute of Plasma Physics, Chinese Academy of Sciences, Hefei, P.R.China * gsxu@ipp.ac.cn. 先进托卡马克运行模式. 对等离子体参数分布的要求. Pedestal 高度和宽度大:

E N D
HT-7 ASIPP Direct Measurement ofLong Poloidal Wavelength EB Flowsin the HT-7 Tokamak G.S.Xu* , B.N.Wan , M.Song , J.Li Institute of Plasma Physics, Chinese Academy of Sciences, Hefei, P.R.China *gsxu@ipp.ac.cn
对等离子体参数分布的要求 • Pedestal高度和宽度大: 以增大等离子体贮能和约束时间,并保持Pedestal区内的压强梯度在稳定性极限以内 • ITB foot半径和宽度大: 以维持高约束的等离子体体积足够大,且其芯区等离子体的压强梯度在稳定性极限以内
新经典输运系数 反常输运 • 实验测定的输运系数 • 磁约束等离子体反常的输运是等离子体湍流引起的
涨落幅度分布 ATF仿星器 TEXT
已在各种磁约束位形中观察到H模 • 托克马克:限制器,偏滤器 • 仿形器 • 磁镜 • 球马克 • 用各种方法都能产生H模 • 各种加热方法:NBI,ECH,ICH,LH和欧姆加热 • 偏压电极和限制器 • H模产生机制必定是普适的 H模是普遍现象
ERS转换的先兆-极向旋转加速 TFTR
径向电场产生机制 • 离子轨道损失:Itoh等人,PRL 60(1988), 2276 • Shaing等人,PRL 63(1989), 2367 • 在边缘区,在一个离子香蕉轨道宽度内离子损失是主要的, • 新经典粘滞与径向电场的非线性关系。 • 输运的非对称性:Hassam等人,PRL 66(1991), 309 • 粒子反常输运的极向非对称性 • 也包括密度和平行流的极向非对称性 • 新经典流:Rozhansky和Tendler, Phys.Fluids B9(1992),1877 • 考虑湍流产生的反常粘滞和惯性对极向动量平衡方程的影响 • 湍流雷诺协强:Hasegawa等人;PRL 59(1987), 1581 • Diamond等人;Phys.Fluids B3(1991),1626
雷诺协强驱动极向流—HT-6M 许宇鸿
关于输运垒的结论 • ExB流剪切在输运垒的形成中起重要作用 • 某些约束分岔存在剪切极向旋转加速的先兆 • 湍流雷诺协强可以驱动极向流的加速
由静态到涨落的ExB剪切流——zonal flows • 既然静态的径向电场Er(f 0 kHz),以及相应的ExB流剪切在输运垒的形成中起重要作用 • 那么涨落的径向电场Er(f > 0 kHz),以及相应的涨落的ExB流剪切也应当对湍流输运具有剪切去相关效应
Zonal Flows :剪切层流 • Zonal Flows (ZF) • 就是涨落的ExB剪切流 (f 0 kHz) • ZF决定湍流的饱和水平,从而决定输运 • 理论研究表明低频的ZF(0-10 kHz)比高频的ZF对湍流具有更强的剪切去相关效应——这就是输运垒形成的机制 (T.S.Hahm)
以ZF为核心的湍流自调节动力学 • 以ZF为核心的非线性湍流自调节动力学成为解释湍动输运和输运垒形成的自洽模型 • 这一假说是现代输运理论的重要组成部分 • 受到了数值模拟的支持 • 但还没有充分的实验证据
湍流通过Reynolds Stress驱动的Zonal Flows本征模f = 0~10 kHz 可见ZF的性质 (时间和空间尺度) 主要和压强分布有关 P平坦小尺度ZF(涨落)抑制湍流 P陡峭大尺度ZF(静态)输运垒
Zonal Flows实验迹象(2)DIIID 相衬成像PCI测量
Zonal Flows实验迹象(3)DIIID 束发射光谱BES 测量局部密度涨落 时间延迟估计TDE 得到V(t)
Zonal Flows实验迹象(3)DIIID consistent with the theoretically predicted geodesic acoustic modes (GAM)
Zonal Flows实验迹象(4)HT-7 In SOL r = 1 cm G. S. Xu, B. N. Wan and M. Song, Phys. Plasmas 9, 150 (2002).
Search for zonal flows • Since ZF are essentially potential structure, which occur mainly in the poloidal EB flows and are generally expected to be manifested less strongly in the density field (i.e., ), the direct experimental evidence of such flows requires the direct measurement of the poloidal large-scale potential fluctuations and EB flows. 因此可用探针直接测量ZF
Forked Langmuir Probe long distance correlation Reynolds stress sampled at 1 MHz with 12-bit resolution
探针极向间距大于湍流旋涡相关长度 poloidal correlation Length of the edge turbulence L ~ 1 cm forked Langmuir probe with two probe heads poloidally separated by 3.14 cm >> L
Experiment setup ohmic heated deuterium plasmas and the confinement fall into ALCATOR scaling. B 1.8 T Ip 100 kA ne 1.51019 m3, Te0 0.5 keV ne-edge 1.5~41018 m3 Te-edge 40~120 eV discharge duration 1 s
The discharges were stable and reproducible. in such low parameters discharges, the edge safety factor qa>5 and there was no sawtooth and very little MHD activity. MHD MHD noise
边界剪切层的形成可能是由于边界压强梯度较陡,产生低频zonal flows 的结果 • Low edge temperature allowed the probe to be deeply inserted into the plasmas. • A naturally occurring weak shear layer existed at the plasma edge, which resulted in a steeper pressure profile.
standard two-point correlation analysis technique High-resolution of poloidal wave number (1< k <1 rad/cm) the life time of AT eddies is shorter than the transit time of turbulence eddies across the long distance. decorrelation time of f : c 8 s The equilibrium flow velocity is about 2~4 km/s, resulting in an 8~16 s transit time d across the 31.4 mm spatial separation, so that cd.
no low-frequency coherent structure were found in the scrape-off layer a possible reason is that the flow lines on one magnetic flux surface were cut off by the limiters and no toroidally and the ZF (toroidal mode n = 0 and poloidal mode m = 0) can not exist in this region. Typical characteristics Of ambient turbulence _ drift wave like
there was still considerable coherency of the AT, which implies the AT contains many long life components at time scale much longer than the life time of turbulence eddy (10s). • Recent experiments on different devices demonstrated the existence of long-range correlations and self-similarity in plasma fluctuations at time scale 0.03~10ms, which implies long life events contributing significantly to turbulent transport is possibly a universal phenomenon in fusion plasmas.
Broad band low frequency (0 ~ 10 kHz) coherent EB flows were observedat the plasma edge Observation possess many of the characteristics of ZF, including a long poloidal wavelength (small poloidal wave number ki ~ 0) and narrow radial extent (finite radial wave number kri ~ 0.1). For the high-frequency AT, its k spectrum displays obvious characteristics of the drift-wave like and its average kis close to 1 rad/cm
Poloidal wavenumber spectrum S(k) Ion direction Electron direction Broad band low frequency potential fluctuations with k ~ 0 kZF ~ 1/2kAT ZF AT edge
narrow radial extentfinite radial wave number kri ~ 0.1 One probe head 1 cm longer than the other one. Since the k of this low-frequency mode is about 0, its kr can be approximatively estimated as kr k 0.8 rad/cm . If we presume Ti Te, then we can calculate the ion gyroradius as i 0.7 ~ 1.2 mm kri 0.06 ~ 0.1
Clear structure indicates there existed significant difference frequencies (f = f1 f2 < 10 kHz) coupling with the contributing modes (f1, f2)both in the AT frequency band (10~200 kHz) The cross-bicoherence of turbulent Reynolds stress, namely, that of the radial and poloidal EB velocities of the AT with the poloidal EB flows, indicates the existence of nonlinear three-wave coupling processes and the generation of low frequency (0 ~ 10 kHz) EB flows at the plasma edge. It was computed from 1170 realizations (mean removed) of 512 samples. We found that to get converged bicoherence spectrum the ensemble with a large number of realizations is necessary, therefore as long as 300ms records were used. For short record length, the bicoherence spectrum will be dominated by gross feature.
flow-shearing rate 3104s1 The estimated flow-shearing rate 3104s1 is of the same order of magnitude as the turbulence decorrelation rate ~ 12104s1, suggesting that the observed flows are of sufficient amplitude to regulate the fluctuation level and thereby the turbulence-driven transport. The rms amplitude of the low-frequency EB flows, normalized to the ion thermal velocity (VTi 44 ~ 76 km/s) is 0.5% ~ 0.9% at the plasma edge. For comparison, the rms value of the ambient turbulent flows, normalized to VTi is 1.6% ~ 2.7%. The ratio of rms amplitude ~ 1/3