Download
1 / 45
450 likes | 588 Views
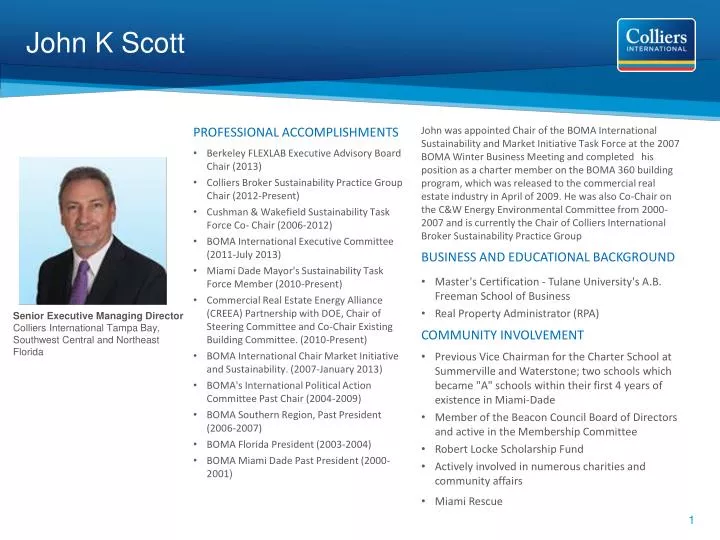
John K Scott. professional accomplishments Berkeley FLEXLAB Executive Advisory Board Chair (2013 ) Colliers Broker Sustainability Practice Group Chair (2012-Present) Cushman & Wakefield Sustainability Task Force Co- Chair (2006-2012) BOMA International Executive Committee ( 2011-July 2013)

E N D
John K Scott • professional accomplishments • Berkeley FLEXLAB Executive Advisory Board Chair (2013) • Colliers Broker Sustainability Practice Group Chair (2012-Present) • Cushman & Wakefield Sustainability Task Force Co- Chair (2006-2012) • BOMA International Executive Committee (2011-July 2013) • Miami Dade Mayor's Sustainability Task Force Member (2010-Present) • Commercial Real Estate Energy Alliance (CREEA) Partnership with DOE, Chair of Steering Committee and Co-Chair Existing Building Committee. (2010-Present) • BOMA International Chair Market Initiative and Sustainability. (2007-January 2013) • BOMA's International Political Action Committee Past Chair (2004-2009) • BOMA Southern Region, Past President (2006-2007) • BOMA Florida President (2003-2004) • BOMA Miami Dade Past President (2000-2001) • John was appointed Chair of the BOMA International Sustainability and Market Initiative Task Force at the 2007 BOMA Winter Business Meeting and completed his position as a charter member on the BOMA 360 building program, which was released to the commercial real estate industry in April of 2009. He was also Co-Chair on the C&W Energy Environmental Committee from 2000-2007 and is currently the Chair of Colliers International Broker Sustainability Practice Group • business and educational background • Master's Certification - Tulane University's A.B. Freeman School of Business • Real Property Administrator (RPA) • community involvement • Previous Vice Chairman for the Charter School at Summerville and Waterstone; two schools which became "A" schools within their first 4 years of existence in Miami-Dade • Member of the Beacon Council Board of Directors and active in the Membership Committee • Robert Locke Scholarship Fund • Actively involved in numerous charities and community affairs • Miami Rescue Senior Executive Managing Director Colliers International Tampa Bay, Southwest Central and Northeast Florida
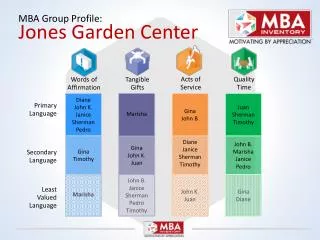
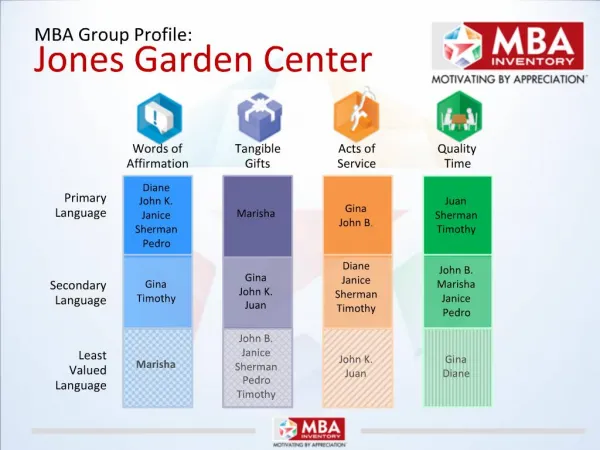
Colliers Sustainability Sustainability We educate and lead our team to adopt sustainable practices that increase our Clients’ asset value on an economic, environmental and social basis. Colliers will set and meet specific goals (LEED certifications, ENERGY STAR benchmarking, green procurement programs and green workplace productivity models) and collaborate with our Clients to ensure we optimize property performance, boost building occupant health and productivity, work to reduce our environmental impact and conserve our natural resources. Our long-term corporate value is to generate sustained economic and ecological value for our Clients, which in turn positively affects our communities and employees.
Quote: ”The Greatest use of life is to spend it for something that will outlast it.” - William James
Live: • Define what constitutes Environment: • A major driver of human impact on Earth systems is the destruction of biophysical resources, and especially, the Earth's ecosystems. The environmental impact of a community or of humankind as a whole depends both on population and impact per person, which in turn depends in complex ways on what resources are being used, whether or not those resources are renewable, and the scale of the human activity relative to the carrying capacity of the ecosystems involved. Careful resource management can be applied at many scales, from economic sectors like agriculture, manufacturing and industry, to work organizations, the consumption patterns of households and individuals and to the resource demands of individual goods and services.
Real Estate Owner’s Perspective… • Job loss and business consolidation over past three years have reduced occupancy and rents in most markets • Increased focus retaining tenants, on operating efficiency and value creation • There is increased risk, reduced NOI and value - real estate assets are not performing as underwritten • Sustainability is fundamentally a strategy for improving performance, for competing
Relevance for Brokers? • Top corporations increasingly require green – including the GSA, largest tenant in the US, requiring Energy Star and LEED for all new facilities – means demand is increasing • Green Building Codes – new construction will increasingly be greener and much more energy efficient • Federal, State and Local legislation – increasingly requiring or incentivizing green • Being knowledgeable about sustainability… is a differentiator, shows leadership, adds value to both tenants and landlords you represent and is what the best brokers understand
Energy Efficiency is a Potential Leading Indicator of Overall Superior Operations Quality and Financial Performance Analysis conducted by the CoStar Group of ENERGY STAR buildings compared to peer set of non ENERGY STAR buildings.
Work: • Private vs. Public Partnerships- CREEA – BOMA - USGBC • US Department of Energy- CBEA • CREEA • REA • HEA • BOMA • 7 Point Challenge • Lighting Campaign • USGBC • New EBOM • Recertification of existing Projects
7 Point Challenge • 22 companies reached the primary goal of reducing energy consumption by 30% across their portfolios, and that 17 companies achieved all 7 points of the challenge. • 857 participating buildings representing more than 184 million square feet of office space. • BOMA International now has an amazing story to tell of how voluntary efforts move mountains -- or at least significantly reduce our carbon footprint
7 Point Challenge • On top of submitting, the following companies wowed us by their stunning efforts on all seven points of the 7 Point Challenge:
Pulse of the Industry • Most Pressing Issues Facing Your Members
Sea level rise: IPCC says 7” to 22” by 2100, much more if rapid ice sheet collapse occurs Most scientists would go on record for 1m rise (30 inches)
Work: • Organizational Trends: • Mandatory Versus Voluntary • EPA Energy Star • Seattle • New York • Washington, DC • California • Government and Municipality Requirements • Utilities • Deregulated vs. Regulated • Feed-in-Tariffs • Energy Efficiency - PACE
Work: • Making a difference- The Role of an Individual in Today’s Sustainable Marketplace-Changing Habits One Day at a Time • Education • Waste- The New Starbucks- • Selling Materials To China • Glass is Less Profitable
Better Buildings AllianceWho is Involved? >200 member organizations |>500 individual participants | > 10 billion sq ft Healthcare Nearly 1 billion sq ft Commercial Real Estate & Hospitality > 8 billion sq ft Retail > 2 billion sq ft Higher Ed – 22 members, 200 million + sqft New Public Sector too!
Public Sector Solutions Technology Solutions Market Solutions Commercial Real Estate Food Service Public Buildings Higher Education Grocery Retail Healthcare Hospitality Lighting Financing Strategies Financing Strategies Space Conditioning Leasing and Tenant Engagement Data Management Plug & Process Loads Training / Workforce Strategic Energy Planning Laboratories Appraisals and Valuation Energy Savings Performance Contracts Refrigeration Food Service Tech Data Access Energy Information Systems
2013 Highlights • In 2013, the Better Buildings Alliance members’ combined portfolios totaled over 10 billion square feet for the first time – or 1/8 of the commercial building sector. • Better Buildings Alliance members made significant progress saving energy in their portfolios. On average, members reported average savings of ~2% over the previous year’s energy use. • Project team participation grew by over 75%, with more members than ever actively pursuing energy-savings solutions in the Better Buildings Alliance 15 teams. • To date, we have issued 2 technology challenges, 2 technology adoption campaigns, and 10 procurement specifications to help companies select efficient heating, cooling, lighting, refrigeration, and water heating technologies. If everyone switched today to technologies that meet these specifications, we could save over 1.6 quadrillion Btusand over $10 billion every year. • Formed an advisory board of leading industry organizations to inform the development of a green leasing recognition program and implementation roadmap. • Launched the Data Access initiative as a team under Market Solutions & supported roll-out of the Utility Data Access Accelerator
Procurement Specifications These customizable specifications can be used in writing requests for proposals (RFPs) from vendors and are used in actual procurement documents used by businesses that participate in the Alliance.
LightingFind these online at :ere.energy.gov/BetterBuildingsAlliance High-Efficiency Troffer Lighting Specification: 50% of all commercial fluorescent lighting fixtures are recessed troffers in 1'x4', 2'x2', 2'x4' configurations, in operation for more than 10 hours a day on average and collectively consuming more than 87 TWh of electricity annually. Building owners who use the high-efficiency troffer specification can save 15–45% on their lighting energy costs on a one-for-one basis and up to 75% with the use of controls. Nationwide, if all troffers switched today to meet the Better Buildings Alliance specification requirements, >25TWh of electricity could be saved annually. LED Site (Parking Lot) Lighting Specification: Most parking lots are illuminated by older high-intensity discharge (HID) lighting technology without any energy-saving controls. New light-emitting diode (LED) technology with controls can cut parking lot lighting energy bills by 40% or more while delivering additional benefits including long life, reduced maintenance costs, and improved lighting uniformity. Around 40 TWh could be saved annually if all parking lot lighting nationwide met the high-efficiency lighting specification. High-Efficiency Parking Structure Lighting Specification: Parking structures or garages are often lighted by older HID lighting technology without any energy-saving controls. The latest high-efficiency alternatives with energy-saving controls—including fluorescent, induction, and LED options—can save building owners more than 40% on their parking lot lighting bills compared to typical code, while delivering additional benefits including better-lighted spaces.Nationwide, if all parking structures switched today to high-efficiency lighting that met the requirements of the specification, businesses could save an estimated 36 TWh annually. High-Efficiency Wall Pack Lighting Specification and Application Guidance: In 2013, the Lighting & Electrical Team added the Wall Pack Specification and Application Guidance to its suite of exterior lighting resources. By applying this specification and application guidance, building owners can expect to save 38% on a one-for-one basis and 68% if controls are utilized, as well as reap additional benefits including longer life and lower maintenance costs. Nationwide, if all wall packs switched today to meet the specification requirements, commercial building owners could save an estimated 7 TWh annually. LED Refrigerated Display Case Lighting Specification: This specification delivers approximately 50% energy savings compared to a typical display case lighting code. If all retail refrigerated display cases switched to LED systems today, that could save an estimated 2.1 TWh of electricity annually.
HVAC, Refrigeration, Water Heating & MoreFind these online at: eere.energy.gov/BetterBuildingsAlliance Gas Heaters Specification: High efficiency gas-fired space heaters offer over 10% savings over standard models for semi-conditioned spaces and other locations using non-centralized heating equipment. Improved space heaters that meet the Better Buildings Alliance specification raise efficiency by employing features such as condensing heat exchangers, direct-fired combustion, and infrared technology. If all gas heaters were replaced overnight with products that met the specification, nationwide, commercial building owners would save > 50 TBtu per year. Ultra-low Temperature Freezers (ULF) Specification:A typical ULF can use up to 20 kWh of electricity per day - as much as a small house! High efficiency units that meet the Better Buildings Alliance Specification can save 2,500 kWh per year or up to $1,250 over 5 years. Commercial Heat Pump Water Heater Specification:An older, electric resistance water heater operated in a building with a hot water demand of 500 gallons a day, 365 days a year, can cost more than $3,500 each year in electricity costs. A heat pump water heater that meets the Better Buildings Alliance specification can use 70% less energy and or up to $12,500 over 5 years. Low-voltage Distribution Transformer Specification: An older transformer in a typical office building can consume 16,000 kWh and cost more than $1,500 in electricity costs per year. Replacing existing, older transformers with a transformer that meets the specification can save up to $5,000 over five years. Fume Hoods Specification: A single fume hood in a typical lab can use more than 20,000 kWh per year. Laboratory fume hoods built to the specification can reduce electricity use by at least 50%, compared to baseline units—while also reducing space conditioning energy loads. Replacing a conventional fume hood with one that meets the specification could save up to 50,000 kWh of energy and $5,000 over five years, while also reducing space-conditioning energy loads. Nationwide, if all laboratory fume hoods were replaced today with hoods that meet the specification, commercial building owners would save > 250 TBtu per years.
Technology Challenges Challenge specifications encourage manufacturers to go above and beyond what is currently available on the market and innovate new technologies that meet customers’ energy efficiency needs. DOE has released two challenge specifications in cooperation with our Better Buildings Alliance members.
Low-cost wireless submeter challenge In 2013, the Better Buildings Alliance launched the wireless submeter challenge with the support of 18 manufactures to date including BLUEdev, Continental Controls, IE Technologies, Leviton, Schneider Electric and others. The Wireless Metering Challenge performance specification challenges manufacturers to develop a wireless metering system that is low cost (less than $100 per point), meets essential requirements for electrical energy measurement, and transmits data wirelessly to an onsite collection point. Sixteen private-sector organizations ranging from grocers to higher education systems have signed letters of intent to purchase meters that meet the challenge. Electricity sub-meters provide building operators with the information necessary to make informed decisions about opportunities to save energy. Nationwide, the Department of Energy conservatively estimates that if commercial buildings could utilize sub-meters to identify energy savings of just 2 percent, it would represent actual cost savings of $1.7 billion. Learn more at http://energy.gov/articles/federal-and-industry-partners-issue-challenge-manufacturers.
RTU Challenge Rooftop units (RTUs) are used in nearly half of all cooling conditioned commercial floor space in the United States. RTUs that meet the Better Buildings Alliance specification are expected to reduce energy use by 30%compared to the current American Society of Heating, Refrigerating and Air-Conditioning Engineers (ASHRAE) 90.1-2010 standard, depending on facility location and type. So far, Carrier and Daikin-Mcquay have been recognized for producing products that meet the challenge’s IEER requirements.
Smart Market Report Introduction The opportunity for improving energy performance in the United States has never been greater. The Better Buildings Initiative proposed by the Obama administration is the latest national effort drawing attention to our building energy consumption and ways we can help reduce it—and win at the same time. The economic downturn shifted the attention of firms and public owners with large building portfolios toward their existing buildings. With government and utility incentives, the time was ripe for focusing on retrofit and renovation investments that could save energy and money. However, despite the fact that retrofit activity remained active during the down economy, only a tiny portion of the U.S. building stock has been affected. The opportunity has never been greater. We merely need to help create and seize those opportunities. In order to do so, it is important to understand what drives American companies and building owners to adopt efficiency improvements and sustainability policies. Understanding those drivers is the first step. Then, it is about making the business case to those different influence agents. We were excited that the U.S. Department of Energy’s Building Technology Program and the Pacific Northwest National Laboratory supported this effort because the results show that energy efficiency is occurring and will continue to occur. The levels of that activity depend on our ability to convey the full breadth of benefits that come from sustainable investments, of which energy efficiency is just the tip of the iceberg.Theresearch in this report provides new McGraw-Hill Construction and others on how to create high-performing buildings. Some critical results include: • The commitment of corporate America to sustainability continues to grow, despite the adverse economy: 42% of the firms surveyed view sustainability as a business opportunity or as transformational, up from 37% just a little over a year ago. • 92% of companies report being influenced by operational savings in their decision to pursue energy efficiency projects, but market differentiation (73%) and employee satisfaction and productivity (71%) are also important. • Renewable energy is seen as a potential business opportunity for some firms. • It is obvious that the business case matters to firms, and energy efficiency and utility savings are the foundation of that case, but firms today expect more. Tenants are using their influence in a high-vacancy commercial • office building market to demand green features (see page 65), and firms want market differentiation and competitive advantage. Whether you are a manufacturer trying to get your energy-efficient products installed, • a builder or engineer experienced in adding value to projects through better building practices, or policy makers wanting to lower • the environmental impacts of our buildings, understanding how to make the right business case to the right person is critical. We hope the data and market insights in this report help you make that case and seize • those opportunities.
Making the Business Case • Importance of the Built Environment • The building sector is the single largest user of energy and emitter of greenhouse gasses in the U.S. Today’s buildings consume 40% of U.S. energy, release 30% of U.S. greenhouse gas emissions and 38% of carbon dioxide emissions, and use nearly 13% of all potable water in the U.S.1 Given that the U.S. is currently the largest global user of energy, it becomes even more important for the design and construction industry to take a leadership role in making buildings more efficient in their use of energy and water. At first glance, designing new buildings and updating existing ones to achieve greater energy efficiency seems to be a straightforward and logical first step towards energy independence in the U.S. To the casual observer, the business case for greater energy efficiency in buildings is obvious. Using existing off-the-shelf technologies can yield impressive energy use reductions. However, when examined more closely with the ultimate goal to achieve net zero energy for all buildings through the combined strategies of efficiency and renewable energy, the massive scale of investment required to upgrade the existing building stock is daunting. In addition, each industry sector has its own challenges, making it necessary to tailor the business case to each sector. • Building Sectors • This study examines the challenges and opportunities presented by four industry sectors in particular: office, retail, healthcare and education. One critical obstacle faced by the office and retail sectors, where buildings are typically leased to tenants, is that the savings generated by building operations often do not directly benefit the owner enough to make it easy to justify an investment. Additionally, tenants are far more conscious of the bottom line rent figures than of incremental operational cost savings.. The office sector faces an additional challenge because office buildings as assets see frequent turnover in ownership as well as tenants, causing the payback period for significant efficiency investments to be longer than the ownership period Thus, an investment that seems sound on the surface does not make a compelling business argument for the level of widespread investment necessary to achieve a serious reduction in energy use in the building sector. The healthcare and education sectors face an entirely different set of issues. Their owners are often nonprofits, government or for-profit businesses with narrow profit margins where the battle for investment dollars is challenging. however, there are unique opportunities in these sectors. Education buildings are expected to offer cutting-edge facilities. Hospitals, and some university buildings, are also particularly intensive users of energy, so decisions that can help them reduce this use can be encouraged with compelling intelligence. Finding Opportunity Through Energy Efficiency and Sustainability and Overcoming Challenges The fundamentally compelling business case for efficiency provides far more opportunities than challenges. The ambitious goal of improving efficiency across the entire built environment is achievable, but only through a serious recognition and response to the obstacles faced in these major industry sectors.
Retrofit and Renovation:Ripe for Opportunity in Energy Efficiency • Overall, the existing building market is an important untapped area for upgrades and activity. The U.S. built environment comprises more than 77.9 billion square feet of commercial building space, and only a small percentage of that is new construction each year.2 In 2008, new commercial construction only accounted for 1.8% of total building floor area. • However, the amount of renovation and retrofit activity remains relatively low. There are many reasons for this, including access to funding, insufficient incentives and lack of interest in upgrading those buildings. McGraw-Hill Construction expects continued growth in major commercial renovation activity over the next five years, with $53 billion anticipated by 2014 for major projects, a large portion of which includes energy efficiency investments and activities. • Energy-Efficient Retrofit and Renovation Projects Are Occurring—and Planned for the Future 78% of respondents plan to do energy efficiency upgrade projects in the next two years. • This is a high commitment to investment, but it is also a slight decline from the level of activity over the last two years. • Business Benefits Are Expected and Can Be Used to Make the Business Case • Firms have high expectations about the benefits coming from sustainability initiatives, including investments in energy efficiency and other green building efforts. In fact, these expectations are increasing over time, only placing more burden on internal staff at these organizations who are responsible for making the business case.Itis incumbent upon the industry to recognize these needs when trying to influence these levels of investment. • Financing: Current Energy-Efficient Retrofit and Renovation Projects Use Internal Resources, Not Outside Funds 85% of the energy efficiency projects were funded through capital budgets and company profits. • Only 16% were financed from performance contracting and 6% from bank loans. Relying on capital budgets and company profits is ultimately a limiting factor for the efficiency market, and financing needs to be made more available and more attractive to help the market grow. Percentage of Firms Planning Energy Efficiency Upgrades in the Next Two Years Expected Business Benefits from Sustainability Adoption
Influencing Energy Efficiency Retrofits: • Utility Savings Lead, But Other Factors Also Significant Businesses recognize a broad range of incentives for investing in efficiency. • Utility cost savings is by far the most important factor; it is selected as a major influence by 43% of respondents, compared to 17% or less for all other factors. • Other factors with larger profit margins, including employee/occupant satisfaction and productivity and improved asset value, can drive the market, but better benchmarks and data are required to make these elements stronger aspects of the business case. • Creating Business Value: Renewables and Net-Zero Energy Buildings Offer Opportunity for Product and Service Companies • The industry sees strong opportunities in investing in renewables and net zero to help grow their businesses. Almost half (42%) of the businesses see an opportunity in buildings achieving net zero and two thirds (66%) regard increasing the percentage of their energy from renewable sources as important for their companies. • Corporate America regards investment in these resources as important for their bottom line, and they express interest in public investment to develop new technologies. Influence Factors Behind the Business Case for PAST Energy Efficiency Retrofit Activities The Shift to Net Zero Provides Opportunity for Our Company in the Market Increasing the Percentage of Our Energy from Renewable Sources Is Important for Our Company
Construction Activity at Large:Renovations versus New Construction • Construction is a critical part of the U.S. economy. At 6.5% of GD P, it is the second largest contributor to U.S. GD P behind healthcare. However, the composition of that activity has changed since the recession—with more emphasis on existing buildings versus new construction. • Construction Activity to Date • In 2010, the value of new U.S. construction starts totaled $431.6 billion, down from $670 billion in 2005. New commercial construction activity ended 2010 at $147 billion, while the value of major commercial retrofit and renovation projects grew from $31.4 billion to $41 billion over the same period.4 In 2010, major retrofit and renovation comprised 64% of all construction projects, up from 60% in 2009, with a steady increase since 2006. A primary reason for this shift may be credit availability during the economic downturn, with less capital available for new construction projects. The result has been an increased emphasis on retrofit and renovation projects. • Commercial Renovation Activity Going Forward • McGraw-Hill Construction expects continued growth in major commercial renovation activity over the next five years, with $53 billion anticipated by 2014 for major projects. Overall, the existing building market is an important untapped area for upgrades and activity. The U.S. built environment covers more than 77.9 billion square feet of commercial building space, and only a small percentage of that is new construction each year.5 In 2008, new commercial construction only accounted for 1.8% of total building floor area.6 However, the amount of renovation and retrofit activity remains relatively low. There are many reasons for this, including access to funding, insufficient incentives and lack of interest in upgrading those buildings. There are shifts that may increase energy efficiency activity: • Concerns about energy consumption, costs and climate change continue to encourage support for increases in the energy efficiency of existing buildings. • Energy efficiency is perceived as affordable and achievable with technologies currently available. Commercial Construction Based on Number of Projects Started (2005–2010) Energy-Efficient Building Share of Retrofit Market (In Billions of Dollars) As a result of the above factors, most retrofit and renovation activity that is occurring includes an energy efficiency element such as lighting or HVA C upgrades (see page 18). Rebates for efficient lighting and mechanical products have encouraged these investments. In 2010, energy-efficient building retrofits comprised 66%–75% of $41 billion of total major retrofit and renovation spending. By 2014 that share is expected to rise to 85%–95% of $53 billion of total major retrofit and renovation spending.
Retrofit and Renovation Regional Activity:Non-Green versus Green • Non-Green (Including Projects That Are Only Energy Efficient) • Value of Project s: Retrofit and renovation projects in the Mid-Atlantic region are the highest in value, followed by the South Atlantic and Pacific regions. This difference may be attributed to the growth in public retrofit and renovation projects encouraged by the provisions of ARRA and other federal government policies. (See page 25 for more on government policies.) • Number of Project s: The South Atlantic region has the highest number of retrofit and renovation projects followed by the East North Central and West South Central regions. Total Value and Number of Renovation Projects by Region (2005–2010)
Data: Business Case for Green andEnergy Efficiency Upgrades • Current and Future Levels of Energy Efficiency Activities • Percentage of Firms Who Have Engaged in Energy Efficiency Activities • The last two years have seen strong energy efficiency activity. • Nearly all (91%) of the firms surveyed have undertaken energy efficiency upgrades on buildings in their portfolio in the last two years. • 42% report that more than 30% of their building portfolio is green or high performing. • These results demonstrate that nearly all of the firms surveyed are familiar with the benefits of energy efficiency. They also reinforce the impact of government incentives for energy efficiency, including rebates and tax credits, from the Energy Independence and Security Act an • Percentage of Firms Planning Energy Efficiency Upgrades in the Next Two Years • 78% of respondents plan to do energy efficiency upgrades on buildings in their portfolio in the next two years. While this indicates a relatively robust market, it also suggests a slight decline expected in overall energy efficiency projects compared to the past two years, when 91% reported doing efficiency projects. Percentage of Firms Who Conducted Energy Efficiency Upgrades in the Last Two Years Percentage of Firms Planning Energy Efficiency Upgrades in the Next Two Years
Business Case for Green & Energy Efficiency Upgrades • Influence Factors on Efficiency Projects in the Last Two Years • Utility cost savings are the strongest influence factor by far, with at least some influence on 92% of the respondents. • Even more striking, though, is the fact that 43% select utility cost savings as a major influence—two to four times more than any other factor. Utility cost savings can be more easily measured and reported than ROI, and they are directly attributable to energy efficiency improvements. • Other Measures Selected by More Than 70% of Respondents. • Market Differentiators: The factor is perceived to be a major influence by 17% of firms surveyed • Employee/occupants satisfaction and productivity improvements: Even though only 8% select employee/occupant satisfaction as a major influence, 33% report that these factors have a good deal of Influence. • These results indicate that making a strong business case for energy efficiency involves promoting several different factors simultaneously. All but one of the categories are selected as influential by over 50% of the respondents, which indicates that multiple factors, rather than just one, are considered in energy efficiency investment decisions. Influence Factors Behind the Business Case for PAST Energy Efficiency Retrofit Activities
Drivers and Obstacles to Corporate Sustainability • Challenges to Corporate Sustainability • The obstacles noted in the 2006 and 2009 studies of these same corporate leaders continue to be challenges today. More firms cite most of the categories, which suggests that, as more companies actively pursue sustainability, awareness of the challenges is becoming heightened • Budget (Capital and/or Operational) By far the greatest challenge is budget (capital and/or operational),cited by 77%. • Measuring ROI: An increasing percentage of firms report concern about measuring ROI associated with sustainability as an obstacle, with 45% of the firms citing it in the current survey compared with 31% in 2009 Challenges to Implementing Sustainability
Business Case for Energy Efficient Building Retrofit and Renovation