Download
1 / 19
190 likes | 197 Views
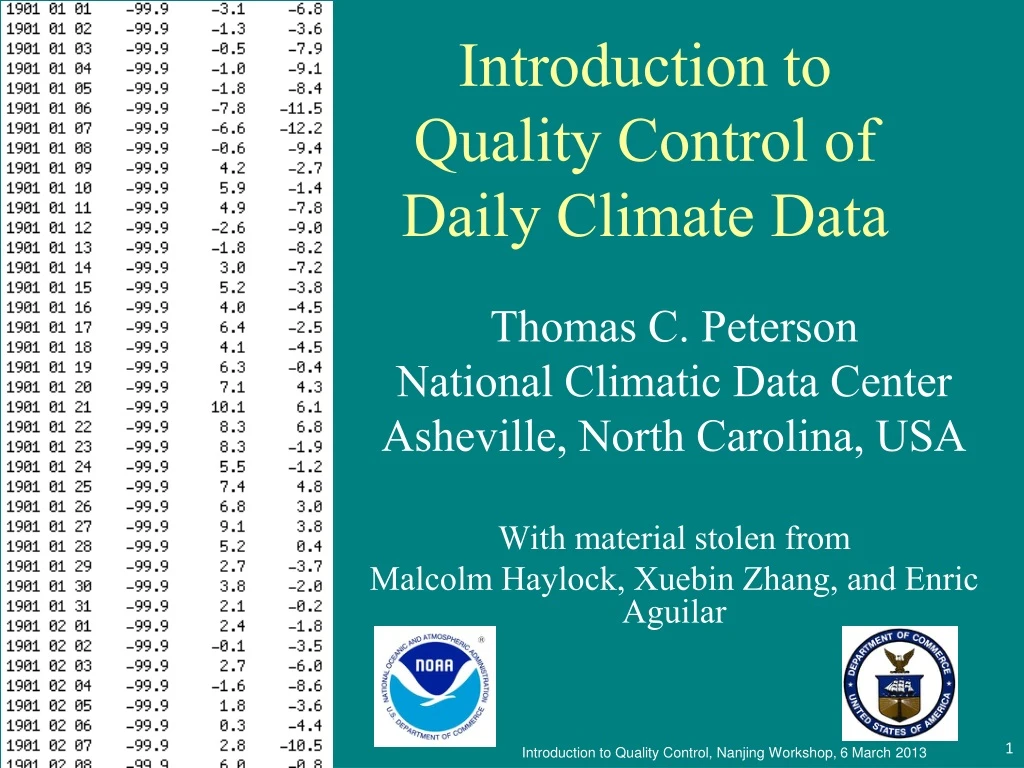
Introduction to Quality Control of Daily Climate Data. Thomas C. Peterson National Climatic Data Center Asheville, North Carolina, USA With material stolen from Malcolm Haylock, Xuebin Zhang, and Enric Aguilar. Outline. Importance of data quality Errors Metadata Data Sources of error

E N D
Introduction to Quality Control of Daily Climate Data Thomas C. Peterson National Climatic Data Center Asheville, North Carolina, USA With material stolen from Malcolm Haylock, Xuebin Zhang, and Enric Aguilar
Outline • Importance of data quality • Errors • Metadata • Data • Sources of error • Outliers • Identifying Problems • Visualisation • Software • RClimDex • Correcting Problems
Importance • Errors associated with measurement can be much larger than the signals that we are trying to measure in climate change detection studies • Some data problems are unique to a particular country but most are not. Your experiences are very helpful to others!
Metadata errors • Metadata • data about data • station history • details instrument changes, site moves • Biggest problem usually lack of accessible metadata • Correct location (including elevation) • Units (decimal degrees or deg-min-sec)
Data errors: biases • Changes in instruments or microscale environment around the station can create biases in the data • These subtle problems will be addressed in the homogeneity analyses later today
Data errors: sources • Observing • Was the thermometer or rain gauge read correctly? • Recording / Digitisation • Was the data properly recorded and digitized? • “Fat Finger Errors” - typing the wrong key • Missing minus signs • Systematic • Are the data in the right units • Are the data what they are suppose to be • E.g., humidity data typed where precipitation should be • Are missing set to zero? • Are three day accumulations of precip appearing as daily precip?
Data errors: observing • precision (rounding) • Noticeable but probably not important
Quality Control tests • Errors (tmax<tmin, out of bounds) • Data plots (time series, stem plots, histograms) • Thresholds excedance (4 SD) for temperature • Comparison with neighbours • Checks of previous days in precipitation in search of missing values • Validation with external sources (workshop participants, hurricane papers, Desinventar database)
Missing Weekend Observations From Viney, N.R. and Bates, B.C., 2004. It never rains on Sunday: the prevalence and implications of untagged multi-day rainfall accumulations in the australian high quality data set. Int. J. Climatol. 24: 1171–1192
Data errors: systematic • units • change of units • correct units for analysis • time of observation
QC EXAMPLE High density in precipitation data around 60-80 turned out to be relative humidity data digitized instead of precipitation
Outliers • Unreasonable extreme values • Indices sensitive to extreme values • Throwing out valid extreme values can cause errors as easily as keeping erroneous extreme values
Detecting Outliers (general concept) • Measure each observation with reference to distribution of observations • Temperature • gaussian (normal) distribution • use standard deviation as reference • Rainfall • positively skewed • quasi-normalise • use cube-root rainfall • use other distribution • gamma distribution • generalised pareto distribution
When is an outlier an outlier? • Err on side of caution • If in doubt, evaluate it • but don’t necessarily set it to missing • Look for collaborative evidence • Surrounding stations • Other data e.g. low Tmax for high rainfall, synoptic pattern • Very hot, cold or wet days usually occur as part of a spell
QC with RClimDex • Data QC after data is loaded • Visualization, TS plots and histogram, log files • Errors treated as missing, logged • P < 0 • Tmin < =Tmax • |Tmin, Tmax| >= 70°C • Tmin and Tmax outliers • Daily mean and std calculated • Check within [mean–n*std, mean+n*std] • Default n is 3 (99.7% or about 1 day/year for independent data) • Outlier test for precipitation is visual
Correcting errors • Very difficult to correct daily data • tmin > tmax • swap? Minus sign missing? One or both in error? • outlier: typographic (Fat Finger) error • e.g. 31.0 should be 13.0 or 21.0 • Check with day before and day after • check with neighbouring stations • Always preserve the original data so future data users will know what was observed and what changes you made
Conclusion • Data quality of prime importance • Accuracy and consistency • Problems may be identified but more difficult to correct • Undetected problems always possible • Exactly how we will do QC will be shown next