Download
1 / 15
150 likes | 160 Views
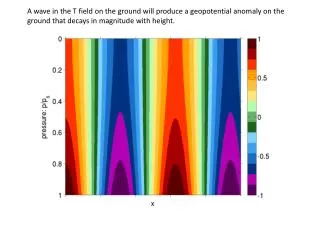
April 2005 Summary of CDAS/GDAS/GFS. - 200 hPa geopotential heights in the GDAS analysis are lower than in CDAS between 20 o N to the South Pole. - 200 hPa geopotential heights are consistently lower for GDAS compared to CDAS since at least November 2004 over the global Tropics.

E N D
April 2005 Summary of CDAS/GDAS/GFS • - 200 hPa geopotential heights in the GDAS analysis are • lower than in CDAS between 20oN to the South Pole. • - 200 hPa geopotential heights are consistently • lower for GDAS compared to CDAS since at least • November 2004 over the global Tropics. • The CDAS monthly precipitation is < observations over the • near-equatorial Tropics in the Northern Hemisphere, the SPCZ • and over the SACZ and > over much of the Southern • Hemisphere near-equatorial Tropics • - GFS precip. >> than obs. over equatorial South America and • the Atlantic ITCZ at all fcst. Projections (1-15 days) • - Precip. near equator & date line is much too weak at later • projections in the GFS (10-15 days) • Vertical velocity and upper-level divergence fields are • consistent with the precipitation differences over the Pacific • near-equatorial regions in the GDAS/GFS. • - GDAS 2m temperatures are generally 1-3K warmer over the • land surfaces compared to CDAS
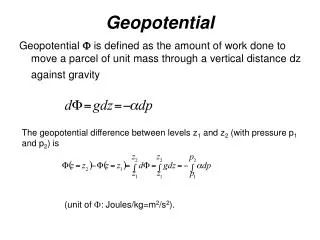
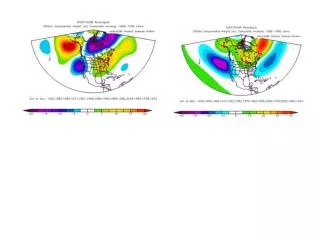
200 hPa geopotential heights in the GDAS analysis are lower than in CDAS between 20oN to the South Pole. The magnitude of the differences over the Tropics are equivalent to about 1 standard deviation in the CDAS monthly means over the 1971-2000 base period.
Time series of 200 hPa heights for GDAS and CDAS over the Tropics indicate that heights are consistently lower for GDAS compared to CDAS since at least November 2004, and that this difference occurs over land as well as ocean, although the difference is largest over the oceans.
The CDAS monthly precipitation accumulations for April 2005 are less than the satellite-gauge (“CAMS_OPI”) observations over most of the near-equatorial Tropics in the Northern Hemisphere, the SPCZ and over the SACZ. CDAS indicates heavier accumulations than the observations over much of the Southern Hemisphere near-equatorial Tropics except in the region from 70oE to the date line.
The difference between the April 2005 precipitation anomalies between CDAS and the observations has a very similar pattern to the difference in the monthly accumulation (previous graphic) particularly over the near-equatorial Pacific.
GFS precip. much larger than obs. over equatorial South America and the Atlantic ITCZ at all fcst. projections. Central Pacific ITCZ is much too strong at the early forecast proj- ections. Precip. near equator & date line is much too weak at later projections in the GFS.
Over the U.S. during April 2005, overestimates of precipitation over the eastern two-thirds of the nation (25-50%) in the average of the “Day-1” forecasts is reduced considerably in the “Day-15” average.
The CDAS OLR is generally cooler over the continents compared to observed OLR, although this difference may be due to the fact that observed OLR is from measurements at only a few times of day (0200/1400 LST at the equator). However, the GDAS OLR is higher by 20-40 w m-2 over most of the global Tropics, and 20 to more than 80 w m-2 higher than CDAS OLR over the continents and parts of the Tropics.
The evolution of near-equatorial OLR anomalies during Nov 2004 through Apr 2005 in CDAS shows negative anomalies for the entire period near the date line. That contrasts with the observed OLR which indicates negative anomalies there during Dec 2004 through Feb 2005 only. However, the positive anomalies to the east and west of the date line in CDAS match the observed OLR quite well. Note that GDAS anomalies are not plotted because a reliable climatology is not available from GDAS due to the many model changes that have occurred during the GDAS record.
The GDAS upward motion at 500 hPa is considerably stronger than CDAS over the ITCZs in the Atlantic and Pacific which is consistent with the higher rainfall in GDAS over those areas compared to CDAS (see earlier precip. figs – buttons below). This is also consistent with differences in the upper-level Divergence (button below). CDAS precip GDAS precip Divergence
GDAS vertical velocity (500 hPa) is consistently higher than CDAS over tropical land regions, generally a bit higher over the SPCZ, and generally a bit lower over the tropical oceans (averaged globally). Both are in good agreement over the NH oceanic storm tracks.
GDAS 2m temperatures are generally 1-3K warmer over the land surfaces compared to CDAS, except in the Middle East and India
Where they differ, the CDAS anomalies are mostly cooler than the CAMS (station) data.