Download
1 / 38
380 likes | 519 Views
Image processing for selected biological experiments. J. Schier , B. Kovář ÚTIA AV ČR, v.v.i. Contents. Counting of yeast colonies (Future projects): Microarray scans Images from the FISH analysis (Fluorescence In-Situ Hybridization). 2. Counting of yeast colonies. Where, why?

E N D
Image processing for selected biological experiments J. Schier, B. Kovář ÚTIA AV ČR, v.v.i.
Contents • Counting of yeast colonies (Future projects): • Microarray scans • Images from the FISH analysis (Fluorescence In-Situ Hybridization) 2
Counting of yeast colonies • Where, why? • Application area: microbiology • Testing influence of substance in the growth medium on innoculated colonies (size, growth rate) Test setup • Colonies innoculated on Petri dishes • Grown in a growth box (constant temperature and humidity) • Dishes sampled by digital camera 3
Growth box and imaging workplace 4.2.2010 5
Time consuming Limited number of samples Limited precision Manual counting Quantitative analysis of images Area and number of colonies Automated counting
Problems • Darkroom – controlled environment, but… Random factors: • Varying position of the dish • Varying illumination, zoom setting • Dispersion of colony size & morphology • Colonies are often touching each other
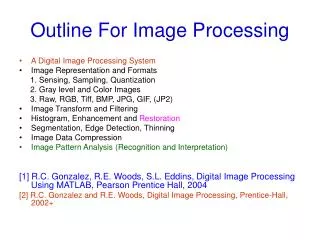
Two phases of dish processing • Preprocessing • Image checking and thresholding • Dish localization, ROI extraction • Evaluation of characteristics • Relative area • Colony diameter estimation • Segmentation – counting of colonies • Output filtration
Preprocessing No fancy math, but necessary: Detect and reject faluty images!! Localization ROI extraction
Background thresholding Elimination of faulty images:
Localization – dish rim? • First solution: correlation of mask with dish rim • Not sufficiently robust – rim variations (shape, width, reflections,..)
Localization - projections Binary image Projections
Localization – cont’d • Position check – dish out of image: • Only rim – OK, • use Least Squares to refine • Inner part of dish – REJECT!
Counting methods • Convolution method • based on convolution with circular pattern • Fast Radial Symmetry (Loy&Zelinsky) • Orientation & magnitude image computed from gradient • Both methods need estimate of colony radius • Adaboost, Hough Transform etc. not used – noisy, learning,...
Radius estimation Round Irregular Colony counting MinRadius, MaxRadiusradii=[.....]
Colony counting I • Convolution method radii vector→circular convolution patterns ColonyCenters
Colony counting II • Fast radial transform (Loy&Zelinsky 2003) • Image gradient • Orientation and Magnitude Matrices • Result – symmetry matrix
Output filtration • Reject centers in the background - “out of colony” • Use “non-maxima suppression” Dilate output image of counting, look for common points with original output
Results - overview • 117 images evaluated, containing from 9 to 106 colonies • Fast Radial Transform: • 81 images – no error • 105 images – all colonies detected (some detected multiple times) • Convolution: • 36 images – no error • 45 images - all colonies detected (some detected multiple times)
Prezentace ZS Test data 2
Prezentace ZS Results
Prezentace ZS Results cont’d Minimum number of colonies: 9 Maximum number of colonies: 106
Prezentace ZS Results – cont’d Minimum coverage: 0,44% Maximum coverage: 12,48%
Detection examples Convolution Fast Radial Symmetry
Prezentace ZS Typical detection errors Convolution Fast Radial Symmetry
Difficult example from the beginning… Result: • Coverage 42.73% • Total 598 colonies • Detected 462 • Missed 136 (Fast Radial Symmetry)
Conclusions Semi-automated processing of batches of Petri dish images Two methods proposed Interactive graphical editor of the result Evaluation of efficiency Improved process over manual evaluation
Outcomes of the research • Tool deployed and in practical use: • Yeast Colony Group • Department of Genetics and Microbiology • Faculty of Sciences • Charles University • Journal paper in review process: • Computer Methods and Programs in Biomedicine (Elsevier)
Outcomes of the research • Established cooperation with two groups • Yeast Colony Group (YCG) • Department of Biology and Medical Genetics, Charles University in Prague - 2nd Faculty of Medicine (UBLG) • 2 grant proposals: • Image processing for microarrays (GAČR, UTIA+YCG) • System for FISH analysis evaluation (TAČR, UTIA+FIT+UBLG+CAMEA s.r.o.)
DNA microarray processing • 14000 spots with red and green fluorescence(ratio of mRNA content of a given gene for two samples) • Image processing: • determination of exact location and size of the spot • elimination of the spots with strong background • Currently: high ratio of manual processing
FISH analysis • FISH = Fluorescence In-Situ Hybridization • sample, containing DNA to be examined, is hybridized with a probe • probe: DNA fragment marked with a fluorescence dye • if the DNA sample contains complementary fragments, • the probe will match • this can be observed in a fluorescence microscope • the presence of signal indicates presence of a chromosome containing the DNA sequence
FISH analysis • Application • Detection of Turner syndrom (1 out of 2500 newborn girls) • Growth distortions, infertility,.. • X monosomy in mosaic form with frequency <1% ! • Detection of Klienefelter syndrome, etc. etc.