Download
1 / 6
60 likes | 180 Views
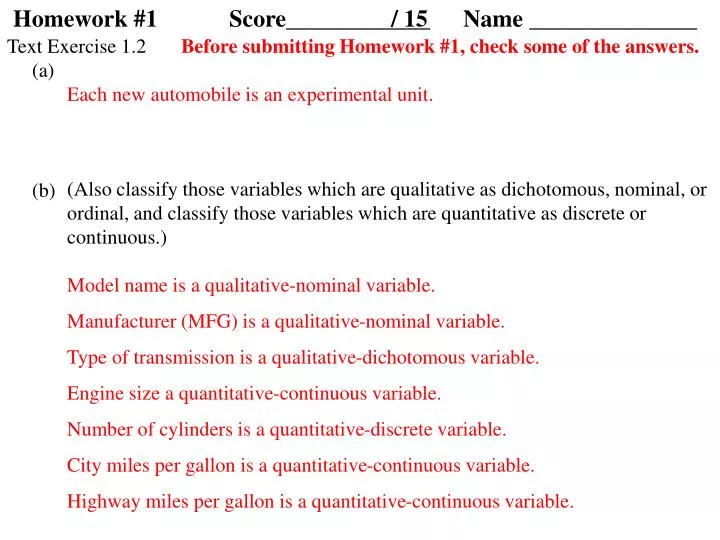
Homework #1 Score____________. / 15 Name ______________. Text Exercise 1.2 (a) (b). Before submitting Homework #1, check some of the answers. Each new automobile is an experimental unit.

E N D
Homework #1 Score____________ / 15 Name ______________ Text Exercise 1.2 (a) (b) Before submitting Homework #1, check some of the answers. Each new automobile is an experimental unit. (Also classify those variables which are qualitative as dichotomous, nominal, or ordinal, and classify those variables which are quantitative as discrete or continuous.) Model name is a qualitative-nominal variable. Manufacturer (MFG) is a qualitative-nominal variable. Type of transmission is a qualitative-dichotomous variable. Engine size a quantitative-continuous variable. Number of cylinders is a quantitative-discrete variable. City miles per gallon is a quantitative-continuous variable. Highway miles per gallon is a quantitative-continuous variable.
Text Exercise 1.4 (a) (b) (c) Each surgical patient is an experimental unit. Whether or not herbal or alternative medicines are used is the variable measured. (Also, if the data is qualitative, indicate whether it is dichotomous, nominal, or ordinal, and if the data is quantitative, indicate whether it should be treated as discrete or continuous.) This variable is qualitative-dichotomous.
Text Exercise 1.6 (a) (b) Text Exercise 1.8 (a) (b) (c) (d) The 500 surgical patients represent a sample selected from a population. Since the 500 surgical patientswere randomly selected, we assume that this sample will be a representative sample. The sample consists of the 505 teenagersrandomly selected from all US teenagers. The population consists of all US teenagers. Since the 505 teenagerswere randomly selected, we assume that this sample will be a representative sample. The topics teenagers most want to discuss with their parents is the variable measured.
(e) (f) Text Exercise 1.10 (a) (b) (c) (d) The inference is expressed in terms of the percentages of the population who select specific topics. A margin of error is a measure of reliability. The population of interest consists of all men and women. The sample consists of the approximately 300 men and women from Gainesville, Florida who participated in the study. Since the researcher wants to generalize the sample results to the entire population, inferential statistics is involved. (Also, if the data is qualitative, indicate whether it is dichotomous, nominal, or ordinal, and if the data is quantitative, indicate whether it should be treated as discrete or continuous.) Each variable in the study is whether or not where an object was placed can be recalled; this is qualitative-dichotomous.
Text Exercise 1.12 (a) (b) (c) (Also, indicate whether the qualitative variable is dichotomous, nominal, or ordinal.) The role selected as most salient is the variable in the study; this variable is qualitative-nominal with the 8 categories listed in the table. raw frequencies Use SPSS to create a bar chart and a pie chart by doing the following: Step 1: Step 2: Step 3: Enter SPSS (and if you are confronted with a dialogue box asking you "What would you like to do?“, bypass this dialogue box by clicking on the Cancel button.) Begin with a blank data window on the screen. Go to the Variable View sheet by clicking on the appropriate tab at the bottom of the screen, The first column of this sheet is for the names of variables. Type role in the first cell of the first column, and type number in the second cell of the first column. The variable role needs to be coded so that 1, 2, 3, 4, 5, 6, 7, and 8 respectively represent the eight categories listed in the exercise. Click on the cell in the Values column which is in the row of the variable role.
Step 19: Step 20: Make certain that no item in the output is selected. (If any item is selected, click once in a blank area to deselect the item.) From the main menu of the SPSS output window, use the File> Print Preview options, and notice that the pie chart and its title have been separated. To fix this, click on the Close button, and click once on the title for the pie chart to select this title. Next, select the Insert> Page Break options. Once again, make certain that no item in the output is selected. Use the File> Print options to obtain a printed copy of the bar chart and pie chart. Since there is no need for you to save the output, you may close the SPSS output window without saving the results, after you have your printed copy of the output. Attach this printed copy to this assignment before submission. Exit from SPSS. (d) Use the SPSS output produced in part (c) in answering this part of the exercise. The role with the highest percentage (424/1102 = 38.5%) is “Spouse”.