Download
1 / 12
120 likes | 320 Views
Why Specific Cognitive Processing Weaknesses Are Typically Only Partial Explanations for Academic Deficits:. It Is Hard To Explain That Which Is (Mostly) Unexplained. W . Joel Schneider Department of Psychology. Assumptions. Perfect multivariate normality Linear relationships only

E N D
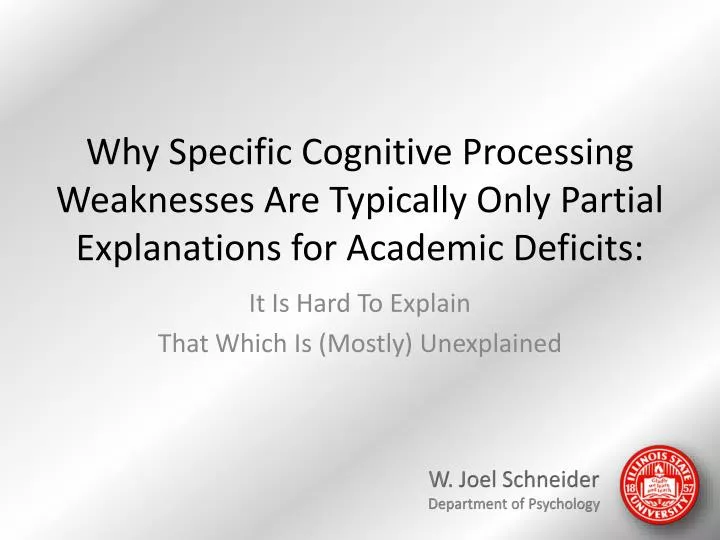
Why Specific Cognitive Processing Weaknesses Are Typically Only Partial Explanations for Academic Deficits: It Is Hard To Explain That Which Is (Mostly) Unexplained W. Joel Schneider Department of Psychology
Assumptions • Perfect multivariate normality • Linear relationships only • Correlations are population parameters. These assumptions are unlikely to be strictly true but they are probably not that far from reality.
Cognitive Strength Gc = 100 Gc = 100 Difference = 25 Reading Decoding =75 Difference = 25 Difference = 0 Phonological Awareness =75 Phonological Awareness =75 Academic Deficit Does this weakness explain the academic deficit? Cognitive Weakness
Multiple Regression Error ~N(0,152(1 - R2)) Error~N(0,11.642) Gc = 100 Error = -18.4 Error 1 1.00 0.420 b1 31.55 b0 Gc~N(100,152) Reading Decoding =75 1 Ŷ = 93.4 Ŷ 0.68 rGc.PA 0.264 b2 Ŷ ~N(100,(15R)2) Ŷ ~N(100,9.462) RD~N(100,152) Phonological Awareness =75 Multiple R = rŶ.RD R2 = 0.40 RD = b0 + b1 * Gc + b2 * PA + error RD = b0 + b1Gc + b2PA + error PA~N(100,152) 75 = 31.55 + 0.420 * 100 + 0.264 * 75 + -18.4 Correlations from WJ III NU (ages 9 to 13): Ŷ = 93.4 Predicted RD when Gc = 100 and PA = 75
This is what “40% of the variance explained” looks like. 6.6 points ≈ 0.5 SD So, instead of a range of nearly 4 SDs, the 95% CI has narrowed to “only” 3 SDs. Reading Decoding = 75 is somewhat unusual in both distributions.
RD distribution when Gc = 100 and PA = 75 ~N(93.4,11.642) Predicted RD = 93.4 when Gc = 100 and PA = 75 5.7% of kids with Gc = 100 and PA = 75 have RD ≤ 75
RD distribution when Gc = 100 and PA = 100 ~N(100,11.642) Predicted RD = 100 when Gc = 100 and PA = 100 Gc = 100 PA = 75 1.6% of kids with Gc = 100 and PA = 100 have RD ≤ 75 Gc = 100 PA = 100
The risk of low performance is low for people with either profile, but the relative risk of low performance is much higher when PA is low. The relative risk of low performance increases if the threshold for defining “low performance” is lower.
RD distribution when Gc = 100 and PA = 6 ~N(75,11.642) If Gc = 100, how low does PA have to be before we have a good explanation of RD = 75? PA must be less than 6 before it is typical for a person with Gc = 100 to have RD ≤ 75. Predicted RD = 75 when Gc = 100 and PA = 6 In a normal distribution, only about 1.2 people in the whole world have a score 6 or lower! 50% of kids with Gc = 100 and PA = 6 have RD ≤ 75
What about Multiple Deficits? RD~N(100,11.242) 1.3% risk of RD≤75 Relative Risk = = 6.4 RD~N(90.5,11.242) 8.4% risk of RD≤75
Conclusions We must abandon dichotomous thinking. The question is not whether some ability is relevant to some outcome, but how much. Often, as in the demonstration here, a relevant predictor is merely a risk factor for low performance and is unlikely to be a sufficient explanation.
Current Context Development & Learning History Best Available Data and Models