Download
1 / 10
100 likes | 228 Views
3rd SIG43 Workshop : Dynamics of non-spherical particles in fluid turbulence, Udine, Italy, April 6th - 8th, 2011. Characteristics of Inertial Fibre Suspensions in a Turbulent Pipe Flow. Stella Dearing*, Cristian Marchioli , Alfredo Soldati Dipartimento di Energetica e Macchine,

E N D
3rd SIG43 Workshop: Dynamics of non-spherical particles in fluid turbulence, Udine, Italy, April 6th - 8th, 2011 Characteristics of Inertial Fibre Suspensions in a Turbulent Pipe Flow Stella Dearing*, CristianMarchioli, Alfredo Soldati Dipartimento di Energetica e Macchine, Università di Udine, Italy 3rd SIG43 Workshop: Udine, Italy, 2011
Applications: Whichindustries benefit Inertial fibres suspended in turbulent flows are commonly encountered industry • Pulp and paper processing • Controlling rheological behaviour and fibre orientation distribution crucial to optimiseoperations • Furniture Industry • Pneumatic transport of fibres • Nappy Fabrication • Fluff, cellulose fibres, make up 60% of nappy material. Uniform distribution is highly desirable for increased absorption • Fibres as an alternative to polymers as a DRA? • Examples include the TAPs, medical application, firehouse • Fibres provide more modest reductions but improved shear degradation and filterability Experimental data is required to validate simulation assumptions, develop and improve current models, provide industry with practical correlations for sizing of industry equipment (aim not to oversize) 3rd SIG43 Workshop: Udine, Italy, 2011
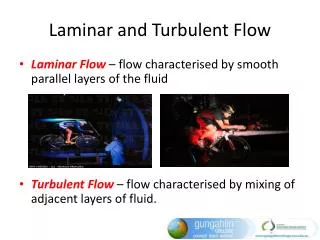
Motivation: WhyStudy? • Fibre suspensions have complicated rheological properties that are quite different than carrier fluid even at low mass fractions. The physical properties f(fibre spatial distribution & orientation) • Fibres rotate/align when subject to velocity gradient –hydrodynamic drag of fibres is f(rotational motion) controls translational motion • Strong turbulence tends to randomise orientation (BERNSTEIN &SHAPIRO) • BUT coherent structures interact with fibres causing segregation and accumulation (MARCHIOLI et al. PHYS. FLUIDS. 2010) DNS one way coupling no fibre-fibre interactions Reτ=150; Re = 9000 Benchmarking required! z 3rd SIG43 Workshop: Udine, Italy, 2011 y
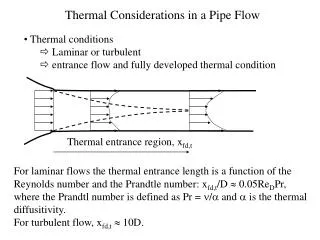
Set-up: Pipe Circuit measurements Laser Mirror z Camera Flow Direction x ϕ/7 • ND Yag laser 1000mJ z ϕ/5 • PCO sensicam 1280 x1024 • F = 8hz 3rd SIG43 Workshop: Udine, Italy, 2011 x
ExperimentalParameters Frequency, % 3rd SIG43 Workshop: Udine, Italy, 2011
Software development: PhaseDiscrimination • Preprocessing • 2. Object Identification • 3. Discriminate object type based on length & aspect ratio • Ellipse fitting • Calculate statistics zi Mean orientations • Normalised number density 3rd SIG43 Workshop: Udine, Italy, 2011
Software development: Statisticscalculation and validation Artificial images Results mean orientation Green triangles DNS data (Marchioliet al., 2010) at Re = 9000, Red squaresexperimental data Re = 8043 Projected fibre onto plane random distribution tends to 0.64 vs 0.5 3rd SIG43 Workshop: Udine, Italy, 2011
Results: Meanorientations • Fibres strongly align to the streamwise direction close to wall • Alignment decreases with distance from wall but does not become completely random • Alignment reduction increases with Re for mass fraction of 0.01% • Alignment reductions tends to same value for all Re at mass fraction of 0.02%. DNS Reτ=150; Re = 9000 3rd SIG43 Workshop: Udine, Italy, 2011
Results: Normalisedmeannumber density Re = 8043 DNS Reτ=150; Re = 9000 • Near wall peak; reduction away from wall • Less fibresat near wall cf at higher Re cf to Re=8043 • At 0.02% less fibres close to wall, increase in fibres away from wall 3rd SIG43 Workshop: Udine, Italy, 2011
Conclusions • Phase discrimination technique and validation has been presented. • Limitations and errors have been quantified. • Phase discrimination technique is appears suitable for the problem( 3D set-up) • First set of experimental data of orientation/distribution close to wall • Mean orientation and number density data qualitatively agrees with DNS data promising. • High Re number tests: sensitive to concentrations. • Deposition at higher Re tests. Why? • More information required • Information on decomposed velocity flow field is required. • Study for instantaneous images with high frequency camera • We are in the process of doing error analysis of phase discrimination PIV algorithm using a DNS flow field 3rd SIG43 Workshop: Udine, Italy, 2011