Download
1 / 38
380 likes | 747 Views
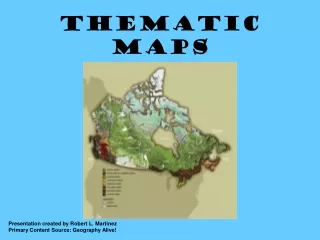
Thematic Maps. Choropleth, Proportional/Graduated Symbol, Digital Image, Isoline/Isopleth and Dot Distribution Maps. Choropleth Maps In these maps, each area (spatial unit) is filled with a color or pattern. These are the maps we see most often. Choropleth Map

E N D
Thematic Maps Choropleth, Proportional/Graduated Symbol, Digital Image, Isoline/Isopleth and Dot Distribution Maps
Choropleth Maps • In these maps, each area (spatial unit) is filled with a color or pattern. • These are the maps we see most often.
Choropleth Map • Maps that show the density information about an area “per unit area” are choropleth maps. Also, a map that would show who owns what areas of land would be a choropleth map.
Advantages of Choropleth Maps • It provides an easy way to visualize how a measurement varies across an area. • When defining regions is important to a discussion (as in an election map divided by electoral regions), choropleths are preferred. • Choropleth maps are also appropriate for indicating differences in land use, like the amount of recreational land or type of forest cover.
Disadvantages of Choropleth Maps • They give a false impression of abrupt change at the boundaries of shaded units. • It can be difficult to distinguish between different shades in the maps. • They have terrible problems with induction (e.g.: even though not everyone voted Republican in a state, when they color it red on a map on TV it LOOKS like everyone did) • boundaries of unit areas are arbitrary sometimes (e.g.: “the South”)
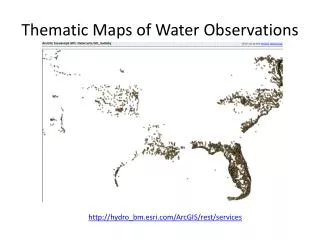
Digital Images • These maps are actually digital images • A grid of cells (pixels) are assigned a color that corresponds to a specific value or range of values
Digital Image Map This kind of map is being used to map environmental occurrences seen from remote sensing systems like satellites
Proportional Symbol/Graduated Symbol Map • In this type of a map, a symbol is selected, usually a circle because it’s easier to work with.
Proportional Symbol Map • The symbol will vary in its size from place to place on the map. This is because the symbol represents different quantities in different places.
Advantages of proportional symbol maps: • They show data occurring at points • They show absolute values (precise numbers) • The circles can be subdivided to show percentages of the whole • They are easy to make
Disadvantages of Graduated Symbol Maps: • Densities/ratios/rates are hard to show with this map • It’s hard to tell the relationship between the different circle sizes
Isoline/Isopleth Maps These maps are used to show quantities that vary smoothly over the earth’s surface. These maps can take two forms: 1. Lines of equal value (“iso” means equal) or 2. Ranges of similar value are filled with similar colors or patterns.
Advantages of Isoline Maps • Good for showing gradual change over space • They avoid the sudden changes which boundary lines produce on choropleth maps. Temperature, for example, is something that should be mapped using isopleth maps, since temperature exists at every point (is continuous), yet does not change abruptly at any point (like population density may do as you cross into another census zone).
Disadvantages of isopleth maps: • They are not suited for showing discontinuous or 'patchy' distributions • A large amount of data is required for accurate drawing.
Dot Distribution Maps • Dot distribution maps use dots to show the quantity of something in a given area or areas.
Advantagesof Dot Distribution Maps easy to understand show the varying density of a phenomena dot placement: placement of dots takes into account the distribution of other phenomena: a dot map of crop acreage would not place dots in urban areas, a dot map of population would cluster dots near urban areas, etc. Therefore, patterns are meaningful. Allows for mapping with another distribution of some other phenomena: e.g. use multi-colored dots, or use dot maps over choropleth map. Therefore, they are good for complex maps
Disadvantages of Dot Distribution Maps • There is a human tendency to underestimate density and it’s easy to do with this map • If dots get too dense, it is difficult to read • Dot placement: computer placement of dots is often random; thus, patterns are often not meaningful if the map is misleading.
Dot Distribution Maps • If not created properly, these maps, and other maps, can be confusing. • In the map you will see, dots were placed randomly to identify alligator populations in the countries of North America • What does the map you will see imply?
Cartograms These are maps that show the amount of something by increasing or decreasing the size of the area in which the “something” is found.
Advantages of Cartograms • Good at showing the relationship between spatial units • Disadvantages • Difficult to read