Download
1 / 1
10 likes | 110 Views
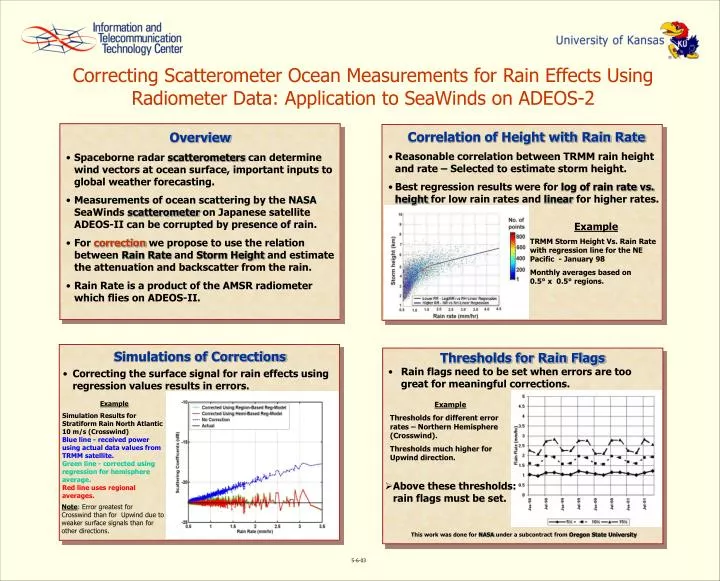
Correcting Scatterometer Ocean Measurements for Rain Effects Using Radiometer Data: Application to SeaWinds on ADEOS-2. Correlation of Height with Rain Rate. Overview Spaceborne radar scatterometers can determine wind vectors at ocean surface, important inputs to global weather forecasting.

E N D
Correcting Scatterometer Ocean Measurements for Rain Effects Using Radiometer Data: Application to SeaWinds on ADEOS-2 Correlation of Height with Rain Rate Overview • Spaceborne radar scatterometers can determine wind vectors at ocean surface, important inputs to global weather forecasting. • Measurements of ocean scattering by the NASA SeaWinds scatterometer on Japanese satelliteADEOS-II can be corrupted by presence of rain. • For correction we propose to use the relation between Rain Rate and Storm Height and estimate the attenuation and backscatter from the rain. • Rain Rate is a product of the AMSR radiometer which flies on ADEOS-II. • Reasonable correlation between TRMM rain height and rate – Selected to estimate storm height. • Best regression results were for log of rain rate vs. height for low rain rates and linear for higher rates. Example TRMM Storm Height Vs. Rain Rate with regression line for the NE Pacific - January 98 Monthly averages based on 0.5° x 0.5° regions. Simulations of Corrections Thresholds for Rain Flags • Rain flags need to be set when errors are too great for meaningful corrections. • Correcting the surface signal for rain effects using regression values results in errors. Example Simulation Results for Stratiform Rain North Atlantic 10 m/s (Crosswind) Blue line- received power using actual data values from TRMM satellite. Green line - corrected using regression for hemisphere average. Red line uses regional averages. Example Thresholds for different error rates – Northern Hemisphere (Crosswind). Thresholds much higher for Upwind direction. • Above these thresholds: rain flags must be set. Note: Error greatest for Crosswind than for Upwind due to weaker surface signals than for other directions. This work was done for NASA under a subcontract from Oregon State University 5-6-03