Download
1 / 21
210 likes | 303 Views
Background material science ideas that may be of use. This presentation is partially animated. Only use the control panel at the bottom of screen to review what you have seen. When using your mouse, make sure you click only when it is within the light blue frame that surrounds each slide. SiO.

E N D
Background material science ideas that may be of use. This presentation is partially animated. Only use the control panel at the bottom of screen to review what you have seen. When using your mouse, make sure you click only when it is within the light blue frame that surrounds each slide.
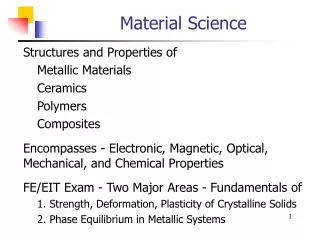
SiO SiC 2 Solid SiHCl 3 A) Starting Materials Start with Sand Finish with EGS Electronic Grade solid silicon Poly-crystalline (Quartzite) Chemical Vapor Deposition Reactor Si liquid hot Coke Furnace gas Fuel gas HCl Hydrogen gas Heat Exchanger Fluidized Bed Metallugical grade silicon pure Si Trichorosilane Solid MGS Micron sized particles Pulverizer Distillation Column
(dm/dt) solid Uniformly Heat and insulate the Melt. ( This makes the liquid (dT/dx) Liquid ( ) , ( k H ) + ( A ) dT dx ) ( dm dt ) s s s s B) Unit Process Models for Proper Control (Process control is best achieved when the equipment follows the model) Crystal growth is an excellent example of how equipment and model cooperate to accomplish the task Crystal Growth Model Temperature gradient in solid crystal near the solid crystal interface Temperature gradient in liquid at a location near the liquid interface The small change in solid crystal mass because of a small change in time " (dT/dx) - (dT/dx) liquid Solid Growth Approach Adjustments to Model Constraints (Three adjustments to equipment to make growth process match simplify model) 1) = 0 2) Slow Pull Rates. (This makes (dx) small value and allows use of calculus) 3) Crucible Surface Area Approximates A and Crystal Rotates Slowly. s (This makes heat of fusion the only new heat source and (dT/dx) predictable) S This Gradient has Known Shape and Values ' s Thermal Conductivity for Crystal Near Liquid Interface
( d v dt ) ( k H ) ( 1 ) ( dT dx ) + , ) D s s s s Seed single crystal is slowly rotated while being pulled out of the melt Chuck that Holds Single Crystal Single Crystal of Wafer Material with know Amount of Dopent Added. Single Crystal crystal attached to chuck to obtain a specific crystal orientation with plane of melt Fused Silica Crucible Adds oxygen to Melt Degenerately Doped Melt comes from Sand Electronic Grade Si ( Quartzite ) that has been treated in an arc furnace followed by HCl rinses and Uniformly Heated factional distillation to become EGS Crucible Holder Wafer Finish Pulled single crystal rod is checked Aligned rod carefully polished and by X-ray camera for crystal alignment then sliced to near wafer dimensions. Density of Crystal Near Melt Interface Czechralski Method (CZ Growth) = Linear Pull Rate
MGS EGS Crucible Metal Grade Electronic Grade Silica B 50 0.001 0.23 Fe 2,100 5. 6 P 30 0.002 - As - 0.01 0.005 C 80 0.6 - 0 - 0.02 0.05 nd “VLSI Technology”, 2 Edition, S.M. Sze, McGraw Hill, 1988 Impurity Sources ( PPM) Note: CZ Growth used over 99% of time. Other option is Float Zone Crystal Growth Process. Good reference for CZ growth, “Characterization & Engineering of the Antimony Hero-Antisite Defect in LEC Gallium Arsenide, Ph.D. Dissertation, Marshall Wilson, U. South Fl. 1997
(with Some Lewis Electron Structures) Group I III IV V VI VII VIII Number He H B C N O F Al Si P S Cl Ar Ga Ge As Se Br C)Wafer Material Performance Adjustments Gallium Arsenic Lewis diagrams show the atom as its symbol plus its electrons in the outer orbit Every atom in a Group has the same number electrons in outer orbit. Impurities the Crystal Structure Although unwanted impurities exist within a crystal structure, in most micro and nano applications, a “special” impurity, the dopant, is added to the crystal structure.
O About 6 A Si About 6 A o -10 About 6 A 1 A = 10 Meters Two views of a cubic crystal structure 3 D Perspective Interstitial Location Lattice Point
Si Si Si Si Si Si Si Si Si Si Si Si Si Si Si Si Si Si Si Si Si Si Si Si Si Si Si Si Si
A dopant will be driven by equilibrium considerations to a specific concentration ratio between two possible phases if given enough time and stable conditions to do so. C C k / s equilibrium With C = Concentration of Dopant in the Crystal Being Pulled s s C = Concentration of Dopant in the Melt below the Crystal l l Often the driving equilibrium considerations are to complicated to understand because of the arrangement of the equipment and any additional components within the melting system. In this situation an effective segregation coefficient, k , is used. seq - (B/D) ( v v ) k k ( 1 [ k +( 1 - k ) ( e ] / seq seq eq eq eq eq eq v = Pull Rate; k takes on values from k to 1.0 seq seq eq eq Doping During Crystal Growth Equilibrium Segregation Coefficient Equilibrium Segregation Coefficient ' Effective Segregation Coefficient Segregation Coefficient With: = B = Boundary Layer; Note: D = Diffusion Coefficient
Si Si Si Si Si Si Si Si Si Si B B Si Si Si Si Si Si Si Si Si Si Si Si Si Si P P Si Si Si Si Si Si Si Si Si Si Si Si Si Si Si Si Si Si Si Si Si Si Si Si Si Si (Boron’s unoccupied outer orbit hole (Phosphorus's non-bonded outer electron can move about the slab of material and can move about the slab of material and generate local areas of positive charge) generate local areas of negative charge) Summary Two Views of a Doped Cubic Crystal Structure Phosphorus atom on a substitutional lattice location Boron atom on a substitutional lattice location n-type Doped Arrangement p-type Doped Arrangement
Substrate with Substrate with No localized charge inequality in either Acceptor atom Donor atom Si Si Si Si Si Si of these slabs of doped silicon. The local charge around Si Si P B Si Si the boron adds up to zero. The local charge around the Si Si Si Si Si Si the phosphorus in the n doped slab also adds up to zero. N = N = D A Local and Universal Charge Characteristics 1) At Low Temperatures Both of these Slabs (n-type and p-type) Remain Overall Neutral p-type Doped Arrangement n-type Donor Arrangement Number Density of Acceptors Number Density of Donors
Si Si Si Si Si Si Si Si B P Si Si electron has entered this location so electron left this location so region is now more negative than it region is now more positive was before it got there. Si Si Si Si Si Si than it was before it left. N = D N = Density of Charged Acceptors A p = Number Density of Holes n = Number Density "Free" Electrons Si Si Si Si B Si Si Si Si Local and Universal Charge Characteristics 2) Raise the temperature of the lattice “Ionized” acceptor “ionized” donor atom Density of Charged Donors Concentration of ions = Concentration of carrier 3) Add ion to slab so it finally exchanges with a lattice location An Ion Lattice with new ion becomes charged
a a O About 6 A o -10 1 A = 10 Meters D) Wafer Issues Orientation Surface planes and directions based on Miller Indices (001) (001) (111) (100) (110) (010) (100) (100) (The 111 perspective)
22 3 Slab Density N = 5 x 10 atoms/cm total 14 2 Face Density N = 6.8 x 10 atoms/cm (100) 14 2 Face Density N = 9.6 x 10 atoms/cm (110) + Highly Doped Wafer Cross-Section ( p ) 18 18 3 3 N = 1 x 10 atoms/ cm Boron 22 22 3 3 N = 5 x 10 atoms/ cm Silicon Concentration of Constituents Typical Intrinsic Densities Number Density of Constituents
+3 10 10 ohm-cm 1 ohm-cm; 15 -3 5 x 10 atoms/cm +2 10 Graph for Educational Value Only. Do not use Values for Accurate Work. +1 10 0 10 -1 10 16 -3 5 x 10 atoms/ cm -2 10 -4 10 3 Dopant Density #/cm Important Parameters Conductivity = (Charge/Carrier)(Mobility of Carrier)(Density of Carrier) Resistivity Conductivity = (1/ Resistivity) When Dopant is a p-type Material When Dopant is an n-type Material Resistively Ohm-Cm -3 10 14 15 16 17 18 19 20 10 10 10 10 10 10 10 (Sometimes before the first process step the wafer may have an excess amount of dopant that defines the wafer’s resistivity.)
Epitaxial Film Less than 20 micrometers epi layer 665 micrometers Common p-epi layer resistivities values are from 1 0hm-cm through 10 ohm-cm. 16 -3 5 x 10 atoms/ cm are needed. (i.e. about 1 PPM) from Resistivity plot, from Resistivity plot, Primary reason to build an epi layer coated substrate is to adjust the resistance between the circuit to be built on the top of the epi layer ( ) (( L ) / ( A ) ) 15 -3 and the back side of the wafer below the epi layer. 5 x 10 atoms/cm are needed. (i.e. about 0.1 PPM) Example- Epitaxial Film Concentration How many Boron (dopant) atoms should be put into an epi layer with a resistivity of; A) 1 ohm-cm; B) 10 ohm-cm Resistance of a Material Resistance = (resistivity) ((length material)/ (cross-section area)) R =
-13.6 ev ( E - E ) = 5 4 E 4 E 5 -0.136 ev Conductance Single Atom Many Atoms Close Together Band E (Alone and Lonely) 9 (In a Solid Crystal Lattice) E E E 6 9 5 The E Band 5 Gap E E 3 4 E E 2 3 E 2 E E 1 1 E) Electronic Influence of Contaminates Energy Level Approximate Values for Isolated Atom in Space Energy of Orbit closest to nucleus Energy Levels from Bohr’s Model Not to Scale 2 E = (1/n) (13.6 ev) n ( -0.55 - [ -0.85] ) = + 0.30 ev -3.40 ev Higher Negative Values Energy Values With n being integer energy levels and 13.6 electron volts being Bohr’s energy value for the first orbit of a hydrogen atom -1.51 ev -0.85 ev -0.55 ev -0.21 ev 1 2 3 4 5 6 7 8 9 10 Energy Levels (levels further away from the nucleus) Related Position of Silicon Energy Levels More Positive Energy Values More Positive Energy Values Valance Band
% % ( ) ( N n ) N p A D j j (the letter Sigma Compensated Device (If both n-type and p-type materials are present, the device is said to be compensated) Mask Protecting a Piece of Boron Doped Silicon Phosphorous in Interstital Spaces Note: Charge neutrality occurs when; & % ' Number of ionized acceptors Phosphorous in Substitutional Spaces Number of holes p-type Dopent at Substitutional Sites Metallurgical Junction (Equal Density of Positive and Negative Entities) indicates that all of the items in the region of interested are added together.)
Image Triggering Vocabulary Metallurgical Grade Silicon (MSG) Electronic Grade Silicon (ESG) CZ Growth Lattice Interstitial Locations Substitutional Locations Lewis Diagrams Miller Indicies Resistivity Epitaxial Film Compensated Device Donors Acceptors Equal Charge Density Metallurigical Junction
Image Triggering Vocabulary Metallurgical Grade Silicon (MSG) Electronic Grade Silicon (ESG) CZ Growth Lattice Interstitial Locations Substitutional Locations Lewis Diagrams Miller Indicies Resistivity Epitaxial Film Compensated Device Donors Acceptors Equal Charge Density Metallurigical Junction