Download
1 / 1
20 likes | 152 Views
Initial problems identified and resolved by EMDI participants: inconsistent assignment of biome/vegetation type to Class A and B sites inconsistent NPP units of measure in Class C sites error in extrapolation process for site-specific monthly climate

E N D
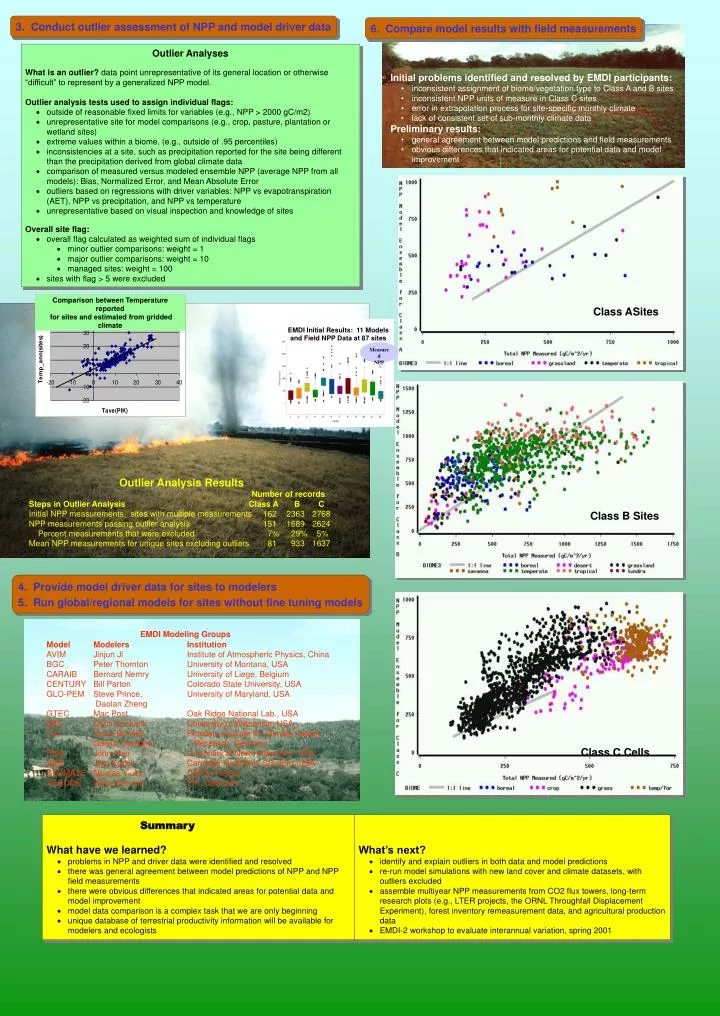
Initial problems identified and resolved by EMDI participants: • inconsistent assignment of biome/vegetation type to Class A and B sites • inconsistent NPP units of measure in Class C sites • error in extrapolation process for site-specific monthly climate • lack of consistent set of sub-monthly climate data • Preliminary results: • general agreement between model predictions and field measurements • obvious differences that indicated areas for potential data and model improvement Comparison between Temperature reported for sites and estimated from gridded climate EMDI Initial Results: 11 Models and Field NPP Data at 87 sites Measured NPP EMDI Modeling Groups Model Modelers Institution AVIM Jinjun Ji Institute of Atmospheric Physics, China BGC Peter Thornton University of Montana, USA CARAIB Bernard Nemry University of Liege, Belgium CENTURY Bill Parton Colorado State University, USA GLO-PEM Steve Prince, University of Maryland, USA Daolan Zheng GTEC Mac Post Oak Ridge National Lab., USA IBIS Chris Kucharik University of Wisconsin, USA LPJ Victor Brovkin. Potsdam Institute for Climate Impact Galina Churkina Research, Germany PNet John Aber University of New Hampshire, USA SIB2 Jörg Kaduk Carnegie Institution, Stanford, USA STOMATE Nicolas Viovy CNRS, France VECODE Victor Brovkin PIK, Germany • Summary • What have we learned? • problems in NPP and driver data were identified and resolved • there was general agreement between model predictions of NPP and NPP field measurements • there were obvious differences that indicated areas for potential data and model improvement • model data comparison is a complex task that we are only beginning • unique database of terrestrial productivity information will be available for modelers and ecologists • What’s next? • identify and explain outliers in both data and model predictions • re-run model simulations with new land cover and climate datasets, with outliers excluded • assemble multiyear NPP measurements from CO2 flux towers, long-term research plots (e.g., LTER projects, the ORNL Throughfall Displacement Experiment), forest inventory remeasurement data, and agricultural production data • EMDI-2 workshop to evaluate interannual variation, spring 2001 3. Conduct outlier assessment of NPP and model driver data 6. Compare model results with field measurements • Outlier Analyses • What is an outlier? data point unrepresentative of its general location or otherwise “difficult” to represent by a generalized NPP model. • Outlier analysis tests used to assign individual flags: • outside of reasonable fixed limits for variables (e.g., NPP > 2000 gC/m2) • unrepresentative site for model comparisons (e.g., crop, pasture, plantation or wetland sites) • extreme values within a biome, (e.g., outside of .95 percentiles) • inconsistencies at a site, such as precipitation reported for the site being different than the precipitation derived from global climate data • comparison of measured versus modeled ensemble NPP (average NPP from all models): Bias, Normalized Error, and Mean Absolute Error • outliers based on regressions with driver variables: NPP vs evapotranspiration (AET), NPP vs precipitation, and NPP vs temperature • unrepresentative based on visual inspection and knowledge of sites • Overall site flag: • overall flag calculated as weighted sum of individual flags • minor outlier comparisons: weight = 1 • major outlier comparisons: weight = 10 • managed sites: weight = 100 • sites with flag > 5 were excluded Class ASites Outlier Analysis Results Number of records Steps in Outlier Analysis Class A B C Initial NPP measurements, sites with multiple measurements 162 2363 2768 NPP measurements passing outlier analysis 151 1689 2624 Percent measurements that were excluded 7% 29% 5% Mean NPP measurements for unique sites excluding outliers 81 933 1637 Class B Sites 4. Provide model driver data for sites to modelers 5. Run global/regional models for sites without fine tuning models Class C Cells