Download
1 / 32
320 likes | 439 Views
On the frequency distribution of heating events in Coronal Loops, simulating observations with Hinode/XRT. Patrick Antolin 1 , Kazunari Shibata 1 , Takahiro Kudoh 2 , Daikou Shiota 2 , David Brooks 3 1 : Kwasan Observatory, Kyoto University

E N D
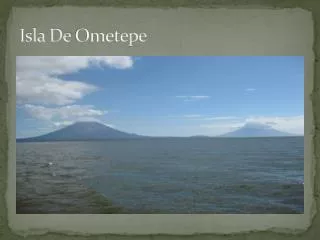
On the frequency distribution of heating events in Coronal Loops, simulating observations with Hinode/XRT Patrick Antolin1, Kazunari Shibata1, Takahiro Kudoh2 , Daikou Shiota2, David Brooks3 1: Kwasan Observatory, Kyoto University 2: National Astronomical Observatory of Japan 3: Naval Research Laboratory IAUS 247, Isla de Margarita, Venezuela, 17 - 22 September 2007
IAUS 247 International Astronomical Union Symposium 247: Waves & Oscillations in the Solar Atmosphere: Heating and Magneto-Seismology. Universidad de Los Andes
Transition region corona Photosphere T [K] Chromosphere height The Solar Corona Coronal Loops (~105km long) seen by TRACE Grotrian, Edlén (1942) point out existence of a 106 K plasma, 200 times hotter than the photosphere. How to heat and maintain the plasma to such a high temperature? The coronal heating problem
Plausible models • Alfvén wave model: (Alfvén 1947; Uchida & Kaburaki 1974; Wenzel 1974). • Alfvén waves can carry enough energy to heat and maintain a corona (Hollweg, Jackson & Galloway 1982; Kudoh & Shibata 1999). - Waves created by sub-photospheric motions propagate into the corona and dissipate their energy through nonlinear mechanisms: • Mode conversion (Hollweg, Jackson & Galloway 1980; Moriyasu et al. 2004). • Phase mixing (Heyvaerts & Priest 1983; Sakurai & Granik 1974; Cally 1991). • Resonant absorption (Goedbloed 1983; Poedts, Kerner & Goossens 1989)
How to recognize between the two heating mechanisms when they operate in the corona? Plausible models • Nanoflare-reconnection model: (Porter et al. 1987; Parker 1988) magnetic flux: current sheets footpoint shuffling reconnection events • Ubiquitous, sporadic and impulsive releases of energy (1024-1027 erg) that may correspond to the observed intermittency and spiky intensity profiles of coronal lines (Parnell & Jupp 2000; Katsukawa & Tsuneta 2001). • However Moriyasu et al. (2004) showed that such profiles can also result naturally from nonlinear conversion of Alfvén waves. (Parker, 1989) Yohkoh/SXT
Shimizu et al. 1995 Observational facts = 1.4 - 1.6 • Energy release processes in the Sun, from solar flares down to microflares are found to follow a power law distribution in frequency, (Lin et al. 1984; Dennis 1985). • Main contribution to the heating may come from smaller energetic events (nanoflares) if these distribute with a power law index > 2 (Hudson 1991). • Initial studies of small-scale brightenings have shown a power law both steeper and shallower than -2 (Krucker & Benz 1998, Aschwanden & Parnell 2002). Hence, no definitive conclusion has been reached at present.
Different characteristics of wave modes Different distribution of shocks and strengths convective motions Reconnection events • Different X-ray intensity profiles & different frequency distribution of heating events between the models. • Link between the power law index of the frequency distribution and the mechanism operating in the loop. Purpose • Propose a way to discern observationally between Alfvén wave heating and nanoflare-reconnection heating. • Diagnostic tool for the location of the heating along coronal loops. Idea:
Numerical model 100000 km • Initial conditions: • T0=104 K : constant • ρ0= 2.5×10⁻⁷ g cm-3, • p0= 2×10⁵ dyn cm-2, • B0=2300 G with apex-to-base area ratio of 1000. • hydrostatic pressure balance up to 800 km height. After: ρ (height)-4 (Shibata et al. 1989). • 1.5-D MHD code • CIP-MOCCT scheme (Yabe & Aoki 1991; Stone & Norman 1992; Kudoh, Matsumoto & Shibata 1999) with conduction + radiative losses (optically thin. Also optically thick approximation). • Alfven wave model: Torsional Alfvén waves are created by a random photospheric driver. φ s Photosphere Chromosphere
Nanoflare heating function • Heating events can be: • Uniformly distributed along the loop. • Concentrated at the footpoints • Energies of heating events can be: • Uniformly distributed. • Following a power law distribution in frequency. Artificial energy injection Photosphere (Taroyan et al. 2006, Takeuchi & Shibata 2001) = 1.5
Non-linear effects Develop into shocks Alfvén waves Slow/fast modes Shock heating Alfvén wave heating • Heating mechanism
Alfvén wave heating For <v2>1/2≿ 2 km/s a corona is created.
~ 2 20 Mm 10 Mm Conductive flux Nanoflare heating
footpoint energy input Gas pressure Slow modes Shock heating Fast dissipation Nanoflare heating uniform Top of TR Apex
Ubiquitous strong slow and fast shocks Alfvén wave Simulating observations with Hinode/XRT 1”x1” F.O.V. Top of TR Apex
Small peaks are levelled out Nanoflare footpoint Simulating observations with Hinode/XRT 1”x1” F.O.V. Top of TR Apex
Flattening by thermal conduction Nanoflare uniform Simulating observations with Hinode/XRT 1”x1” F.O.V. Top of TR Apex
Intensity histograms I2 I1
Alfvén wave Intensity histograms 1”x1” F.O.V. Top of TR Apex = 2.53 = 2.44
Nanoflare footpoint Intensity histograms 1”x1” F.O.V. Top of TR Apex = 1.86 = 1.48
Nanoflare uniform Intensity histograms 1”x1” F.O.V. Top of TR Apex = 2.66 = 0.90
= 2.1 Input: Output: Measurement of power law index depends strongly on the location along the loop, hence on the formation temperature of the observed emission line. Power law index • Footpoint • Power law spectrum in energies • ~ close to the footpoint; decreases approaching the apex due to fast dissipation of slow modes & to thermal conduction
Conclusions • Alfvén wave heated coronas: • Ubiquitous mode conversion -> ubiquitous fast and slow strong shocks. • Intensity profiles are spiky and intermittent throughout the corona. • Power law distribution in energies. Steep index ( > 2), roughly constant along the corona: heating from small dissipative events. • Nanoflare heated coronas: • Uniform heating along the loop: • weak shocks everywhere. • Flat, uniform intensity profile everywhere: Power law index ~ 1. • Footpoint heating: • Strong slow shocks only near the transition region. Fast dissipation and thermal conduction dampingonly weak shocks at apex. • Spiky intensity profiles near the transition region, flattening at apex: power law index becomes shallower the farther we are from the transition region. • If power law energy spectrum at input, the measured index matches original input power law index ( ~ ) only near the transition region. • Measurement of power law index is strongly dependent on location along loops, hence on temperature.
1.5-D MHD Equations • Mass conservation • Momentum equation (s-component) • Momentum equation (-component) • Induction equation( -component) • Energy equation Alfvén wave generator
Radiative losses: • For T > 4 x 10⁴ K: Optically thin plasmas • For T < 4 x 10⁴ K: Optically thick plasmas (Landini & Monsignori-Fossi 1990, Anderson & Athay 1989).
Nanoflare heating function ti < t < ti + τi (Taroyan et al. 2006) • Model parameters: E0 ={ 0.01, 0.05, 0.5 } erg cm-3 s-1; sh={ 200, 500, 1000} km; frequency:{ 1 / 50, 1 / 34, 1 / 7 } s; i ={ 2η, 10η , 40η } s, with η a random number in [0,1]. • Heating events can be: • Uniformly (randomly) distributed along the loop (above 2 Mm height). • Concentrated at the footpoints: randomly distributed in [2,20] Mm, [2,12] or [1,10] Mm height. • Heating events can have their energies: • Uniformly distributed: <E0> = constant • Following a power law distribution in frequency. <E0> otherwise Localization of heating
1= 1.84 2= 2.08 SXT/XRT Intensities Filter Thin Be in XRT similar to filter Mg 3mm in SXT (used in Moriyasu et al. 2004).
Catastrophic cooling events Intensity flux seen with Hinode/XRT Loss of thermal equilibrium at apex due to footpoint heating (Mueller et al. 2005, Mendoza-Briceño 2005).
Alfvén wave Nanoflare footpoint Nanoflare uniform Power law index
= 2.2 = 2.1 = 2.0 = 1.9 = 1.8 = 1.7 = 1.6 = 1.5 Power law index Input: Output: