Download
1 / 13
130 likes | 322 Views
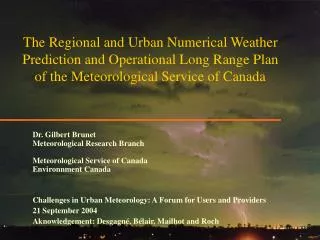
CRTI Project # 02-0093RD. A General Methodology of Urban Cover Classification for Atmospheric Modeling. Lemonsu 1 , A. Leroux 2 , S. Bélair 1 , S. Trudel 2 and J. Mailhot 1. Environment Canada, Meteorological Service of Canada,

E N D
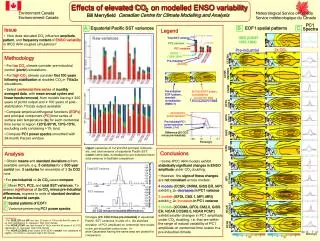
CRTI Project # 02-0093RD A General Methodology of Urban Cover Classification for Atmospheric Modeling • Lemonsu1, A. Leroux2, S. Bélair1, S. Trudel2 and J. Mailhot1 Environment Canada, Meteorological Service of Canada, 1 Meteorological Research Branch 2 Environmental & Emergency Response Div.
Scientific Context • An urban canopy parameterization was recently implemented in the GEM and MC2 Canadian mesoscale models • GEM and MC2 currently use a 1 km global classification including 1 urban class imported from DCW (Danko, 1992) • Specific urban cover classifications are required in order to describe the spatial distribution and spatial variability of urban areas Objective Develop a general methodology to provide new urban land-use land-cover classifications for major Canadian cities (extended to North American cities)
General Approach The methodology is based on a joint analysis of remote sensing data and digital elevation models in order to take both surface characteristics and building height into account Mesoscale urban modeling applications (and possibly future applications to weather forecasting) require: • Free of charge or low cost data • Data covering large urban areas • Data available for major North American cities • Possibility of future updates
Data Sources Classifications were produced for Oklahoma City (OK, US), Montreal (QC, Canada) and Vancouver (BC, Canada) NED National Elevation Dataset SRTM Shuttle Radar Topography Mission CDED Canadian Digital Elevation Data
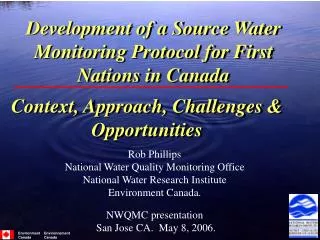
15-m unsupervised classification ASTER/Landsat-7 40 built and vegetated simple elements regrouped in 11 simple elements/criteria 60-m aggregation of classification criteria 1- Excluded covers 2- Water 3- Trees 4- Low vegetation 5- Grass 6- Soil and rocks 7- Roof 8- Concrete 9- Asphalt 10- Veg/built 1 11- Veg/built 2 12-Built 13-Built2 14-Height 1-Excluded covers 2-Water 3-Trees 4-Low vegetation 5-Grass 6-Soil and rocks 7-Roof 8-Concrete 9-Asphalt 10-Veg/built 1 11-Veg/built 2 General Methodology 60-m LULC classification 1-Excluded 2-Water 3-Soils 4-Crops 5-Short grass 6-Mixed forest 7-Mixed shrubs Decision tree 1-High buildings 2-Mid-heigh buildings 3-Low buildings 4-Very low buildings 5-Industrial areas 6-Sparse buildings 7-Roads and parkings 8-Road mix 9-Dense residential 10-Mid-density residential 11-Low-density residential 12-Mix nature and built 15-m building height database SRTM-DEM minus NED/CDED1 Elevation for built-up pixels
N Excluded Water Trees Low vegetation Grass Soil and rocks Roof Concrete Asphalt Veg/built 1 Veg/built 2 Unsupervised classification OKC ASTER image 2001-07-21
N Building heights OKC SRTM-DEM minus NED • Bald Earth’s topography provided by NED (US) and CDED1 (Canada) • Total elevation provided by SRTM-DEM • Height of roughness elements estimated from: SRTM-DEM minus NED SRTM-DEM minus CDED1 • Building heights estimated by considering only built-up pixels • Offset correction • Threshold of 3 m applied to minimum building heights
15-m unsupervised classification ASTER/Landsat-7 40 built and vegetated simple elements regrouped in 11 simple elements/criteria 60-m aggregation of classification criteria 1- Excluded covers 2- Water 3- Trees 4- Low vegetation 5- Grass 6- Soil and rocks 7- Roof 8- Concrete 9- Asphalt 10- Veg/built 1 11- Veg/built 2 12-Built 13-Built2 14-Height 1-Excluded covers 2-Water 3-Trees 4-Low vegetation 5-Grass 6-Soil and rocks 7-Roof 8-Concrete 9-Asphalt 10-Veg/built 1 11-Veg/built 2 General Methodology 60-m LULC classification 1-Excluded 2-Water 3-Soils 4-Crops 5-Short grass 6-Mixed forest 7-Mixed shrubs Decision tree 1-High buildings 2-Mid-heigh buildings 3-Low buildings 4-Very low buildings 5-Industrial areas 6-Sparse buildings 7-Roads and parkings 8-Road mix 9-Dense residential 10-Mid-density residential 11-Low-density residential 12-Mix nature and built 15-m building height database SRTM-DEM minus NED/CDED1 Elevation for built-up pixels
HIGH BUILDINGS ELEVATION >30 m MID-HIGH BUILDINGS ELEVATION >20 m LOW BUILDINGS ELEVATION >10 m BUILT2 >20% VERY LOW BUILDINGS ROADS AND PARKINGS HIGH BUILDINGS LAND/SEA MASK ELEVATION >30 m ROADS >80% MID-HIGH BUILDINGS BUILT>10% ELEVATION >20 m LOW BUILDINGS VEGETATION WATER<80% ELEVATION >10 m VERY LOW BUILDINGS WATER BUILT2>20% BUILT>45% ROAD BORDERS ROOF>20% VEGETATION CLASSES HIGH BUILDINGS DENSE RESIDENTIAL ELEVATION >30 m BUILT >70% MID-HIGH BUILDINGS MID-DENSITY RESIDENTIAL DECIDUOUS BROADLEAF TREES ELEVATION >20 m LOW BUILDINGS SHORT GRASS AND FORBS RESID + MIX >40% ELEVATION >10 m BUILT2 >20% VERY LOW BUILDINGS LONG GRASS ROAD BORDERS BUILT >70% SPARSE BUILDINGS CROPS ELEV>10 m BUILT2>20% ROAD BORDERS MIXED WOOD FOREST BUILT >40% SPARSE BUILDINGS ELEV>10 m BUILT2>20% LOW-DENSITY RESIDENTIAL LOW VEG+ GRASS>60% BUILT & NATURE MIX Decision tree
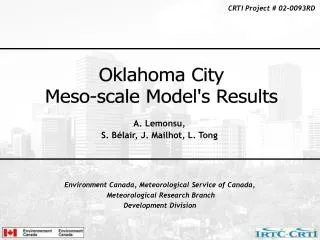
High buildings Mid-high buildings Low buildings Very low buildings Sparse buildings Industrial areas N Roads and parkings Road mix Dense residential Mid-density residential Low-density residential Mix of nature and built Soils Crops Short grass Mixed forest Mixed shurbs Water Excluded Urban classification OKC 60-m resolution classification
N N High buildings Mid-high buildings Low buildings Very low buildings Sparse buildings Industrial areas Roads and parkings Road mix Dense residential Mid-density residential Low-density residential Mix of nature and built Zoom Montreal 60-m resolution classification Vancouver 60-m resolution classification
Conclusions Interest of the methodology • Limited number of data sources • Large availability of the databases • Time processing of about 1 week • General and robust approach applicable to any Canadian city (can be extended to North American cities) Urban classifications • Horizontal resolution adapted to meso-gamma-scale modeling • Good identification of the major urban landscapes • Number of urban classes allowing a satisfying representation of urban cover variability
Roads Bridges Highways Rails Sparse buildings Buildings Residential areas Vegetation Golf Water Future works New approach based on analysis of the vector National Topographic DataBase (NTDB): • Cover of the entire Canada • High resolution: scale of 1:50000 and 1:250000 • Large number of urban features • No manual processing/correction • No interpretation Montreal, NTDB Example of urban features