Download
1 / 42
420 likes | 582 Views
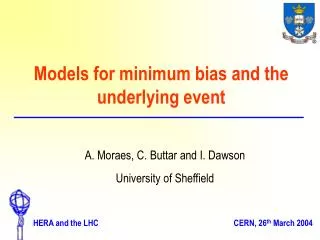
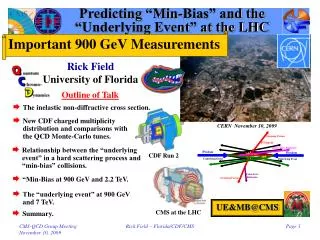
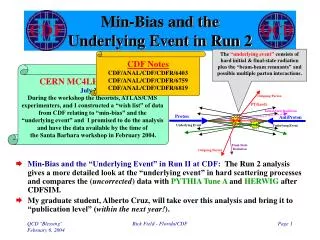
Min-Bias and the Underlying Event in Run 2. The “underlying event” consists of hard initial & final-state radiation plus the “beam-beam remnants” and possible multiple parton interactions. CDF Notes CDF/ANAL/CDF/CDFR/6403 CDF/ANAL/CDF/CDFR/6759 CDF/ANAL/CDF/CDFR/6819.

E N D
Min-Bias and theUnderlying Event in Run 2 The “underlying event” consists of hard initial & final-state radiation plus the “beam-beam remnants” and possible multiple parton interactions. CDF Notes CDF/ANAL/CDF/CDFR/6403 CDF/ANAL/CDF/CDFR/6759 CDF/ANAL/CDF/CDFR/6819 • Min-Bias and the “Underlying Event” in Run II at CDF: The Run 2 analysis gives a more detailed look at the “underlying event” in hard scattering processes and compares the (uncorrected) data with PYTHIA Tune A and HERWIG after CDFSIM. • My graduate student, Alberto Cruz, will take over this analysis and bring it to “publication level” (within the next year!). CERN MC4LHC Workshop July 2003 During the workshop the theorists, ATLAS/CMS experimenters, and I constructed a “wish list” of data from CDF relating to “min-bias” and the “underlying event” and I promised to do the analysis and have the data available by the time of the Santa Barbara workshop in February 2004. Rick Field - Florida/CDF
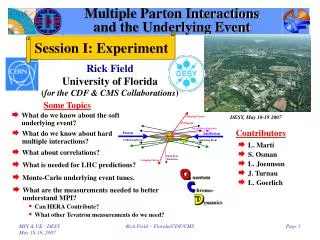
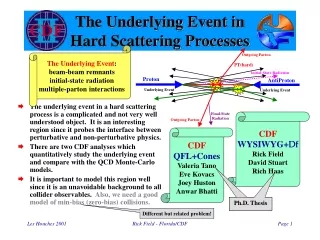
“Transverse” Regionas defined by the Leading Jet Charged Particle Df Correlations pT > 0.5 GeV/c |h| < 1 Look at the charged particle density in the “transverse” region! • Look at charged particle correlations in the azimuthal angle Df relative to the leading calorimeter jet (JetClu R = 0.7, |h| < 2). • Define |Df| < 60o as “Toward”, 60o < |Df| < 120o as “Transverse”, and |Df| > 120o as “Away”. The “transverse region” is very sensitive to the “underlying event”. • All three regions have the same size in h-f space, DhxDf = 2x120o = 4p/3. “Transverse” region is very sensitive to the “underlying event”! Rick Field - Florida/CDF
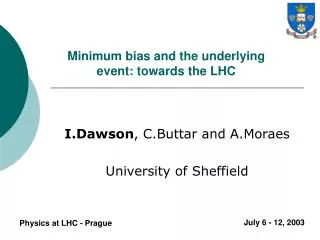
1 charged particle 3 charged particles Divide by 4p dNchg/dhdf = 1/4p = 0.08 dNchg/dhdf = 3/4p = 0.24 Particle Densities Charged Particles pT > 0.5 GeV/c |h| < 1 • Study the charged particles (pT > 0.5 GeV/c, |h| < 1) and form the charged particle density, dNchg/dhdf, and the charged scalar pT sum density, dPTsum/dhdf. CDF Run 2 “Min-Bias” DhDf = 4p = 12.6 Rick Field - Florida/CDF
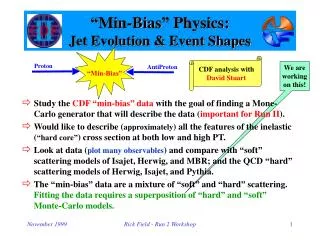
Area = 2(4p)/6 = 4p/3 1 charged particle in the “transverse” region dNchg/dhdf = 1/(4p/3) = 0.24 “Transverse”Particle Densities Charged Particles pT > 0.5 GeV/c |h| < 1 • Study the charged particles (pT > 0.5 GeV/c, |h| < 1) in the “transverse” region and form the charged particle density, dNchg/dhdf, and the charged scalar pT sum density, dPTsum/dhdf. Rick Field - Florida/CDF
Leading Jet Charged Particle DensityDf Dependence • Shows the Df dependence of the charged particle density, dNchg/dhdf, for charged particles in the range pT > 0.5 GeV/c and |h| < 1 relative to jet#1 (rotated to 270o) for “leading jet” events 30 < ET(jet#1) < 70 GeV. Log Scale! Min-Bias 0.25 per unit h-f • Also shows charged particle density, dNchg/dhdf, for charged particles in the range pT > 0.5 GeV/c and |h| < 1 for “min-bias” collisions. Rick Field - Florida/CDF
Charged Particle DensityDf Dependence Refer to this as a “Leading Jet” event • Look at the “transverse” region as defined by the leading jet (JetClu R = 0.7, |h| < 2) or by the leading two jets (JetClu R = 0.7, |h| < 2). “Back-to-Back” events are selected to have at least two jets with Jet#1 and Jet#2 nearly “back-to-back” (Df12 > 150o) with almost equal transverse energies (ET(jet#2)/ET(jet#1) > 0.8). Subset Refer to this as a “Back-to-Back” event • Shows the Df dependence of the charged particle density, dNchg/dhdf, for charged particles in the range pT > 0.5 GeV/c and |h| < 1 relative to jet#1 (rotated to 270o) for 30 < ET(jet#1) < 70 GeV for “Leading Jet” and “Back-to-Back” events. Rick Field - Florida/CDF
0.5 1.0 1.5 2.0 Charged Particle DensityDf Dependence “Leading Jet” “Back-to-Back” Polar Plot • Shows the Df dependence of the charged particle density, dNchg/dhdf, for charged particles in the range pT > 0.5 GeV/c and |h| < 1 relative to jet#1 (rotated to 270o) for 30 < ET(jet#1) < 70 GeV for “Leading Jet” and “Back-to-Back” events. Rick Field - Florida/CDF
“Transverse” Charge Densityversus ET(jet#1) “Leading Jet” “Back-to-Back” Min-Bias 0.25 per unit h-f • Shows the average charged particle density, dNchg/dhdf, in the “transverse” region (pT > 0.5 GeV/c, |h| < 1) versus ET(jet#1) for “Leading Jet” and “Back-to-Back” events. Rick Field - Florida/CDF
“Transverse” Charge Densityversus ET(jet#1) 30-70 GeV 95-130 GeV Very little dependence on ET(jet#1) in the “transverse” region for “back-to-back” events! Rick Field - Florida/CDF
“Transverse” PTsum Densityversus ET(jet#1) “Leading Jet” “Back-to-Back” Min-Bias 0.24 GeV/c per unit h-f • Shows the average charged PTsum density, dPTsum/dhdf, in the “transverse” region (pT > 0.5 GeV/c, |h| < 1) versus ET(jet#1) for “Leading Jet” and “Back-to-Back” events. Rick Field - Florida/CDF
“Transverse” PTsum Densityversus ET(jet#1) 30-70 GeV 95-130 GeV Very little dependence on ET(jet#1) in the “transverse” region for “back-to-back” events! Rick Field - Florida/CDF
“Transverse” Charge DensityPYTHIA Tune A vs HERWIG “Leading Jet” “Back-to-Back” Now look in detail at “back-to-back” events in the region 30 < ET(jet#1) < 70 GeV! • Shows the average charged particle density, dNchg/dhdf, in the “transverse” region (pT > 0.5 GeV/c, |h| < 1) versus ET(jet#1) for “Leading Jet” and “Back-to-Back” events. • Compares the (uncorrected) data with PYTHIA Tune A and HERWIG after CDFSIM. Rick Field - Florida/CDF
Charged Particle DensityPYTHIA Tune A vs HERWIG HERWIG (without multiple parton interactions) produces too few charged particles in the “transverse” region for 30 < ET(jet#1) < 70 GeV! Rick Field - Florida/CDF
dN/dhdf + 0.1 Charged Particle DensityPYTHIA Tune A vs HERWIG • Add 0.1 charged particles per unit h-f to HERWIG density, dNchg/dhdf. • This corresponds to 0.1 x 4p = 1.3 particles in the entire range pT > 0.5 GeV/c, |h| < 1. Rick Field - Florida/CDF
“Transverse” PTsum DensityPYTHIA Tune A vs HERWIG “Leading Jet” “Back-to-Back” Now look in detail at “back-to-back” events in the region 30 < ET(jet#1) < 70 GeV! • Shows the average charged PTsum density, dPTsum/dhdf, in the “transverse” region (pT > 0.5 GeV/c, |h| < 1) versus ET(jet#1) for “Leading Jet” and “Back-to-Back” events. • Compares the (uncorrected) data with PYTHIA Tune A and HERWIG after CDFSIM. Rick Field - Florida/CDF
Charged PTsum DensityPYTHIA Tune A vs HERWIG HERWIG (without multiple parton interactions) does not produces enough PTsum in the “transverse” region for 30 < ET(jet#1) < 70 GeV! Rick Field - Florida/CDF
dPT/dhdf + 0.2 GeV/c Charged PTsum DensityPYTHIA Tune A vs HERWIG 308 MeV in R = 0.7 cone! • Add 0.2 GeV/c per unit h-f to HERWIG scalar PTsum density, dPTsum/dhdf. • This corresponds to 0.2 x 4p = 2.5 GeV/c in the entire range pT > 0.5 GeV/c, |h| < 1. Rick Field - Florida/CDF
“Transverse” Charge DensityPYTHIA Tune A vs HERWIG “Leading Jet” “Back-to-Back” Now look in detail at “back-to-back” events in the region 95 < ET(jet#1) < 130 GeV! • Shows the average charged particle density, dNchg/dhdf, in the “transverse” region (pT > 0.5 GeV/c, |h| < 1) versus ET(jet#1) for “Leading Jet” and “Back-to-Back” events compared with PYTHIA Tune A and HERWIG after CDFSIM. Rick Field - Florida/CDF
Charged Particle DensityPYTHIA Tune A vs HERWIG HERWIG (without multiple parton interactions) agrees much better in the “transverse” region for 95 < ET(jet#1) < 130 GeV! Rick Field - Florida/CDF
“Transverse” PTsum DensityPYTHIA Tune A vs HERWIG “Leading Jet” “Back-to-Back” Now look in detail at “back-to-back” events in the region 95 < ET(jet#1) < 130 GeV! • Shows the average charged PTsum density, dPTsum/dhdf, in the “transverse” region (pT > 0.5 GeV/c, |h| < 1) versus ET(jet#1) for “Leading Jet” and “Back-to-Back” events compared with PYTHIA Tune A and HERWIG after CDFSIM. Rick Field - Florida/CDF
Charged PTsum DensityPYTHIA Tune A vs HERWIG HERWIG (without multiple parton interactions) agrees much better in the “transverse” region for 95 < ET(jet#1) < 130 GeV! Rick Field - Florida/CDF
Min-Bias “Associated”Charged Particle Density “Associated” densities do not include PTmax! Highest pT charged particle! • Use the maximum pT charged particle in the event, PTmax, to define a direction and look at the the “associated” density, dNchg/dhdf. • Shows the data on the Df dependence of the “associated” charged particle density, dNchg/dhdf, for charged particles (pT > 0.5 GeV/c, |h| < 1, not including PTmax) relative to PTmax (rotated to 180o) for “min-bias” events. Also shown is the average charged particle density, dNchg/dhdf, for “min-bias” events. Rick Field - Florida/CDF
Min-Bias “Associated”Charged Particle Density Rapid rise in the particle density in the “transverse” region as PTmax increases! Transverse Region Transverse Region Ave Min-Bias 0.25 per unit h-f • Shows the data on the Df dependence of the “associated” charged particle density, dNchg/dhdf, for charged particles (pT > 0.5 GeV/c, |h| < 1, not including PTmax) relative to PTmax (rotated to 180o) for “min-bias” eventswith PTmax > 0.5, 1.0, and 2.0 GeV/c. • Shows “jet structure” in “min-bias” collisions (i.e.the “birth” of the leading two jets!). Rick Field - Florida/CDF
Min-Bias “Associated”Charged PTsum Density “Associated” densities do not include PTmax! Highest pT charged particle! • Use the maximum pT charged particle in the event, PTmax, to define a direction and look at the the “associated” PTsum density, dPTsum/dhdf. • Shows the data on the Df dependence of the “associated” charged PTsum density, dPTsum/dhdf, for charged particles (pT > 0.5 GeV/c, |h| < 1, not including PTmax) relative to PTmax (rotated to 180o) for “min-bias” events. Also shown is the average charged particle density, dPTsum/dhdf, for “min-bias” events. Rick Field - Florida/CDF
Min-Bias “Associated”Charged PTsum Density Rapid rise in the PTsum density in the “transverse” region as PTmax increases! Transverse Region Transverse Region Ave Min-Bias 0.24 GeV/c per unit h-f • Shows the data on the Df dependence of the “associated” charged PTsum density, dPTsum/dhdf, for charged particles (pT > 0.5 GeV/c, |h| < 1, not including PTmax) relative to PTmax (rotated to 180o) for “min-bias” eventswith PTmax > 0.5, 1.0, and 2.0 GeV/c. • Shows “jet structure” in “min-bias” collisions (i.e.the “birth” of the leading two jets!). Rick Field - Florida/CDF
Min-Bias “Associated”Charged Particle Density PY Tune A PTmax > 2.0 GeV/c Transverse Region Transverse Region PTmax > 0.5 GeV/c • Shows the data on the Df dependence of the “associated” charged particle density, dNchg/dhdf, for charged particles (pT > 0.5 GeV/c, |h| < 1, not including PTmax) relative to PTmax (rotated to 180o) for “min-bias” eventswith PTmax > 0.5 GeV/c and PTmax > 2.0 GeV/c compared with PYTHIA Tune A (after CDFSIM). • PYTHIA Tune A predicts a larger correlation than is seen in the “min-bias” data (i.e.Tune A “min-bias” is a bit too “jetty”). Rick Field - Florida/CDF
Min-Bias “Associated”Charged PTsum Density PY Tune A PTmax > 2.0 GeV/c Transverse Region Transverse Region PTmax > 0.5 GeV/c • Shows the data on the Df dependence of the “associated” charged PTsum density, dPTsum/dhdf, for charged particles (pT > 0.5 GeV/c, |h| < 1, not including PTmax) relative to PTmax (rotated to 180o) for “min-bias” eventswith PTmax > 0.5 GeV/c and PTmax > 2.0 GeV/c compared with PYTHIA Tune A (after CDFSIM). • PYTHIA Tune A predicts a larger correlation than is seen in the “min-bias” data (i.e.Tune A “min-bias” is a bit too “jetty”). Rick Field - Florida/CDF
Back-to-Back “Associated”Charged Particle Densities Maximum pT particle in the “transverse” region! “Associated” densities do not include PTmaxT! • Use the leading jet in “back-to-back” events to define the “transverse” region and look at the maximum pT charged particle in the “transverse” region, PTmaxT. • Look at the Df dependence of the “associated” charged particle and PTsum densities, dNchg/dhdf and dPTsum/dhdf for charged particles (pT > 0.5 GeV/c, |h| < 1, not including PTmaxT) relative to PTmaxT. • Rotate so that PTmaxT is at the center of the plot (i.e. 180o). Rick Field - Florida/CDF
Back-to-Back “Associated”Charged Particle Density “Associated” densities do not include PTmaxT! Jet#2 Region ?? Log Scale! • Look at the Df dependence of the “associated” charged particle density, dNchg/dhdf for charged particles (pT > 0.5 GeV/c, |h| < 1, not including PTmaxT) relative to PTmaxT (rotated to 180o) for PTmaxT > 0.5 GeV/c, PTmaxT > 1.0 GeV/c and PTmaxT > 2.0 GeV/c, for “back-to-back” eventswith 30 < ET(jet#1) < 70 GeV . • Shows “jet structure” in the “transverse” region (i.e.the “birth” of the 3rd & 4th jet). Rick Field - Florida/CDF
Back-to-Back “Associated”Charged PTsum Density “Associated” densities do not include PTmaxT! Jet#2 Region ?? Log Scale! • Look at the Df dependence of the “associated” charged particle density, dPTsum/dhdf for charged particles (pT > 0.5 GeV/c, |h| < 1, not including PTmaxT) relative to PTmaxT (rotated to 180o) for PTmaxT > 0.5 GeV/c, PTmaxT > 1.0 GeV/c and PTmaxT > 2.0 GeV/c, for “back-to-back” eventswith 30 < ET(jet#1) < 70 GeV . • Shows “jet structure” in the “transverse” region (i.e.the “birth” of the 3rd & 4th jet). Rick Field - Florida/CDF
Back-to-Back “Associated”Charged Particle Densities “Back-to-Back” charge density “Back-to-Back” “associated” density • Shows the Df dependence of the “associated” charged particle density, dNchg/dhdf for charged particles (pT > 0.5 GeV/c, |h| < 1, not including PTmaxT) relative to PTmaxT (rotated to 180o) for PTmaxT > 0.5 GeV/c, PTmaxT > 1.0 GeV/c and PTmaxT > 2.0 GeV/c, for “back-to-back” eventswith 30 < ET(jet#1) < 70 GeV. It is more probable to find a particle accompying PTmaxT than it is to find a particle in the “transverse” region! • Shows Df dependence of the charged particle density, dNchg/dhdf for charged particles (pT > 0.5 GeV/c, |h| < 1) relative to jet#1 (rotated to 270o) for “back-to-back events” with 30 < ET(jet#1) < 70 GeV. Rick Field - Florida/CDF
0.5 1.0 1.5 2.0 Back-to-Back “Associated”Charged Particle Densities “Back-to-Back” charge density “Back-to-Back” “associated” density Polar Plot • Shows the Df dependence of the “associated” charged particle density, dNchg/dhdf, pT > 0.5 GeV/c, |h| < 1 (not including PTmaxT) relative to PTmaxT (rotated to 180o) and the charged particle density, dNchg/dhdf, pT > 0.5 GeV/c, |h| < 1 relative to jet#1 (rotated to 270o) for “back-to-back events” with 30 < ET(jet#1) < 70 GeV. Rick Field - Florida/CDF
0.5 1.0 1.5 2.0 Back-to-Back “Associated”Charged Particle Densities “Back-to-Back” charge density “Back-to-Back” “associated” density Polar Plot • Shows the Df dependence of the “associated” charged particle density, dNchg/dhdf, pT > 0.5 GeV/c, |h| < 1, PTmaxT > 2.0 GeV/c (not including PTmaxT) relative to PTmaxT (rotated to 180o) and the charged particle density, dNchg/dhdf, pT > 0.5 GeV/c, |h| < 1, relative to jet#1 (rotated to 270o) for “back-to-back events” with 30 < ET(jet#1) < 70 GeV. Rick Field - Florida/CDF
0.5 1.0 1.5 2.0 Jet Topologies QCD Four Jet Topology QCD Three Jet Topology Polar Plot • Shows the Df dependence of the “associated” charged particle density, dNchg/dhdf, pT > 0.5 GeV/c, |h| < 1, PTmaxT > 2.0 GeV/c (not including PTmaxT) relative to PTmaxT (rotated to 180o) and the charged particle density, dNchg/dhdf, pT > 0.5 GeV/c, |h| < 1, relative to jet#1 (rotated to 270o) for “back-to-back events” with 30 < ET(jet#1) < 70 GeV. Rick Field - Florida/CDF
Back-to-Back “Associated”Charged Particle Density Jet#2 Region Log Scale! • Look at the Df dependence of the “associated” charged particle density, dNchg/dhdf, pT > 0.5 GeV/c, |h| < 1 (not including PTmaxT) relative to PTmaxT (rotated to 180o) for PTmaxT > 2.0 GeV/c for “back-to-back” eventswith 30 < ET(jet#1) < 70 GeV and 95 < ET(jet#1) < 130 GeV. • Very little dependence on ET(jet#1) in the “transverse” region for “back-to-back” events! Rick Field - Florida/CDF
Back-to-Back “Associated”Charged Particle Density Jet#2 Region Log Scale! • Look at the Df dependence of the “associated” charged PTsum density, dPTsum/dhdf, pT > 0.5 GeV/c, |h| < 1 (not including PTmaxT) relative to PTmaxT (rotated to 180o) for PTmaxT > 2.0 GeV/c for “back-to-back” eventswith 30 < ET(jet#1) < 70 GeV and 95 < ET(jet#1) < 130 GeV. • Very little dependence on ET(jet#1) in the “transverse” region for “back-to-back” events! Rick Field - Florida/CDF
“Back-to-Back” vs “MinBias”“Associated” Charge Density “Birth” of jet#3 in the “transverse” region! “Back-to-Back” “Associated” Density “Min-Bias” “Associated” Density Log Scale! “Birth” of jet#1 in “min-bias” collisions! • Shows the Df dependence of the “associated” charged particle density, dNchg/dhdf for pT > 0.5 GeV/c, |h| < 1 (not including PTmaxT) relative to PTmaxT (rotated to 180o) for PTmaxT > 2.0 GeV/c, for “back-to-back” eventswith 30 < ET(jet#1) < 70 GeV. • Shows the data on the Df dependence of the “associated” charged particle density, dNchg/dhdf, pT > 0.5 GeV/c, |h| < 1 (not including PTmax) relative to PTmax (rotated to 180o) for “min-bias” eventswith PTmax > 2.0 GeV/c. Rick Field - Florida/CDF
“Back-to-Back” vs “MinBias”“Associated” PTsum Density “Birth” of jet#3 in the “transverse” region! “Back-to-Back” “Associated” Density “Min-Bias” “Associated” Density Log Scale! “Birth” of jet#1 in “min-bias” collisions! • Shows the Df dependence of the “associated” charged particle density, dNchg/dhdf for pT > 0.5 GeV/c, |h| < 1 (not including PTmaxT) relative to PTmaxT (rotated to 180o) for PTmaxT > 2.0 GeV/c, for “back-to-back” eventswith 30 < ET(jet#1) < 70 GeV. • Shows the data on the Df dependence of the “associated” charged particle density, dNchg/dhdf, pT > 0.5 GeV/c, |h| < 1 (not including PTmax) relative to PTmax (rotated to 180o) for “min-bias” eventswith PTmax > 2.0 GeV/c. Rick Field - Florida/CDF
“Associated” Charge DensityPYTHIA Tune A vs HERWIG HERWIG (without multiple parton interactions) too few “associated” particles in the direction of PTmaxT! And HERWIG (without multiple parton interactions) too few particles in the direction opposite of PTmaxT! Rick Field - Florida/CDF
“Associated” PTsum DensityPYTHIA Tune A vs HERWIG HERWIG (without multiple parton interactions) does not produce enough “associated” PTsum in the direction of PTmaxT! And HERWIG (without multiple parton interactions) does not produce enough PTsum in the direction opposite of PTmaxT! Rick Field - Florida/CDF
For PTmaxT > 2.0 GeV both PYTHIA and HERWIG produce slightly too many “associated” particles in the direction of PTmaxT! “Associated” Charge DensityPYTHIA Tune A vs HERWIG But HERWIG (without multiple parton interactions) produces too few particles in the direction opposite of PTmaxT! Rick Field - Florida/CDF
For PTmaxT > 2.0 GeV both PYTHIA and HERWIG produce slightly too much “associated” PTsum in the direction of PTmaxT! “Associated” PTsum DensityPYTHIA Tune A vs HERWIG But HERWIG (without multiple parton interactions) produces too few particles in the direction opposite of PTmaxT! Rick Field - Florida/CDF