Download
1 / 24
240 likes | 376 Views
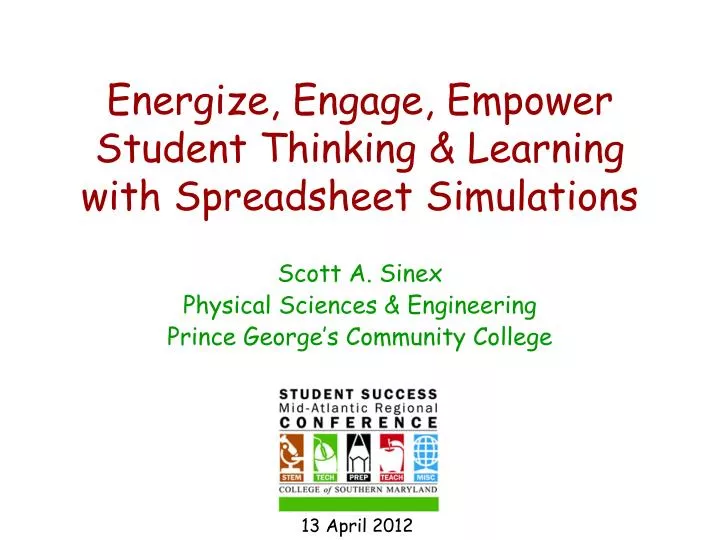
Energize, Engage, Empower Student Thinking & Learning with Spreadsheet Simulations. Scott A. Sinex Physical Sciences & Engineering Prince George’s Community College. 13 April 2012. Let’s roll the die… dice…. die… . dice…. What does the distribution of face numbers look like?

E N D
Energize, Engage, EmpowerStudent Thinking & Learningwith Spreadsheet Simulations Scott A. Sinex Physical Sciences & Engineering Prince George’s Community College 13 April 2012
Let’s roll the die… dice… die… dice… What does the distribution of face numbers look like? How long would it take if rolling by hand?
So let’s roll in a spreadsheet… frequency Predict what the graph would look like! face number Calculation for each roll of a die =RANDBETWEEN(1,6)
To die for: What are the chances? We can investigate variability! http://academic.pgcc.edu/~ssinex/excelets/dice_roll.xls
Why interactive spreadsheets? Easy access for students and teachersand useful for them to know Easy for instructors to develop – see Developer’s Guide to Excelets Creates an engaging pedagogy in math and the sciences “Excel to Engage”
…more why? Addresses topics conceptually, while camouflagingmathematics Students have to think: predict - test - analyze Allows for mathematical modeling and studying errors More science process More multivariable approach (more real world) Mathematics resurfaces!!!! …and explain!!! Yes it returns!!! (Even more)
Do some big time science… …and use some math Data Mathematical model Go AMATYC! Numerical simulation Fine print: Never remove experiments for simulations, add simulations to extend your experiments!
…and address important human interest questions such as: Why is pizza cut in even number of slices? Do you want pepperoni?
A simple interactive visual and for even slices, a straight cut! Here we use spinner from the Forms toolbar. The Forms Tools operate on both PC and Mac platforms. http://academic.pgcc.edu/~ssinex/excelets/fractions.xls
Construct complicated models Is there a relationship between the height of the cookie stack and number of cookies?
“Just add data” Excelet data mathematical model http://academic.pgcc.edu/~ssinex/cookies_stack.xls
backwards Do reverse science process ideal Use the simulation to get the model ^ How does the height of the candle vary over time?
How does a burning candle behave? Here we collect the data by clicking the up arrow on the spinner. animation http://academic.pgcc.edu/~ssinex/excelets/burning_candles.xls
…adding error to the data Scatter is added to the data by increasing random error. =E6+$K$7*RANDBETWEEN(-10,10)/10+$G$10 The circled scroll bar controls the size of random variation.
October 2010 – Collapsed house on Holland Island (?) in Chesapeake Bay! October 2009 - Last house on Holland Island in Chesapeake Bay island? island http://en.wikipedia.org/wiki/Holland_Island coastalcare.org Is sea level changing?
What does tide gauge data tell us? Option buttons allow which data set is viewed. http://academic.pgcc.edu/~ssinex/excelets/inundator.xls
But can just anyone do this? YES!!!
Building a simulation Let’s construct a model for the behavior of the quadratic equation Our multivariable equation y = ax2 + bx + c How does the graph behave when we vary a, b, and c?
Set-up screen Simulation of Quadratic Equation Behavior http://academic.pgcc.edu/~ssinex/excelets/NC/Simulation_QuadraticEqn_NC.pdf
Baseball pop-up and quadratic… Multivariable and a practical application http://academic.pgcc.edu/~ssinex/excelets/quadratics.xls
The “How to” resources... Developer's Guide to Excelets: Dynamic and Interactive Visualization with "Javaless" Applets or Interactive Excel Spreadsheets <http://academic.pgcc.edu/~ssinex/excelets> Tutorial, instructions, and a variety of interactive Excel spreadsheet examples Resource list for mathematics and science
In the end… • Easy access technology both in & out of class • An engaging pedagogy • More scientific and algebraic thinking • More multivariable (real world) approach • Can venture into some more complicated concepts (keep math camouflaged)
More info… • Scott Sinex ssinex@pgcc.edu http://academic.pgcc.edu/~ssinex • Google or Bing: excelets …and THANKS for attending!!!
More resources… • Pittsburgh Supercomputing Center Computation and Science Teachers (CAST) Professional Development Modules (uses Excel, Vensim, and NetLogo) http://www.psc.edu/eot/k12/2011yr.php • Modules 2A, 5A, and 6 – use Excel