Download
1 / 41
410 likes | 429 Views
Correlation Risk and Interest Rate Swaps Spreads. BY JAHANGIR SULTAN Department of Finance BENTLEY COLLEGE WALTHAM, MA 02254 781-891-2518 JSULTAN@BENTLEY.EDU. Correlation Risk.

E N D
Correlation Risk and Interest Rate Swaps Spreads • BY • JAHANGIR SULTAN • Department of Finance • BENTLEY COLLEGE • WALTHAM, MA 02254 • 781-891-2518 • JSULTAN@BENTLEY.EDU
Correlation Risk “The rocket scientists of the financial world have become obsessed with a phenomenon that they cannot price or hedge directly but which they see as the final piece in the jigsaw of risks they must understand and control if they are to manage portfolios effectively. That phenomenon is correlation. Identifying and quantifying correlation risk has become the derivative markets' holy grail." (Parsley, Euromoney,1993)
Correlation Risk: Definition • Correlation risk refers to the change in the payoff/marked to market value of an asset when the correlation between the underlying assets changes over time.
Correlation Dependent Products • Typical equity derivatives book contains volatility risk as well correlation risk –two are correlated—e.g., index arbitrage desk • Products that pay off as a function of max-min of two random processes/underlying stochastics • Quanto options-requires estimating expected correlation between exchange rate and the equity index • Interest Rate Swaps/Currency Swaps/Diff swaps • Spreads
Sources of Correlation Risk • Interdependence among risk factors –co-movement • Contagion –structural breaks in data generating process • Opposite of interdependence • Deviation from a no-arbitrage relationship • Time varying distribution • Bivariate joint distribution of the underlying assets is time varying (non-parallel yield curve shifts) • Market breaks–extreme events –regime shifts • Up market/down market
Correlation Risk: Interdependence • Sensitivity of portfolio value to one risk factor is dependent of the level of another risk factor. Change in one risk factor affects the price sensitivity of other risk factors • Example • CF (X1, X2) = CF(X1) * CF (X2) • CF (cash flows) • X1, X2 (risk factors)
Correlation Risk: Multi-factors • Return generating process includes effects of multi-factors • Variance of the portfolio for example could include own factor variances of assets as well as correlations with other factors
Correlation Risk: Contagion • Opposite of interdependence • Increase in variance of one firm’s returns is caused by economy wide relationship between firm and its lending partners, suppliers, and other related entities –wide spread credit problem • Excess correlation –during periods of market breakdowns correlation is greater than under normal market conditions
Correlation Risk: Time Varying Distribution • If the bivariate joint distribution of the underlying assets is time varying then the covariance matrix is changing over time; • So the correlation is also changing over time.
Estimating Measures of Correlation Risk • Methods of estimating correlation risk: • Implied correlation from options • Error-correction term • (represents short-term uncorrelatedness in a long-term steady-state equilibrium model) • Time Varying correlations • (multivariate GARCH models of two underlying assets)
Error Correction Model (ECM) • ECM is derived from a cointegrating relationship between two fundamentally related variables. • ECM represents the amount of short-term deviation of variables from a no-arbitrage relationship between them. It represents the amount of correction needed to bring the system back to equilibrium.
Multivariate GARCH Model • To avoid convergence problems the H matrix is assumed to be block-diagonal. This intuitively plausible assumption says that volatilities are determined by the lagged squared residuals as well as past volatilities much the same way as an ARMA model is defined.
Time Varying Covariance Matrix • Time Varying Hedge Ratio: • Time Varying Correlations:
Usefulness of Multivariate GARCH Models • Volatility Spillover - off diagonal coefficients in H can help trace the impact of one market on another. • Dynamic Hedge Ratio - • Arbitrage Trigger - ECM term can be used as the trigger mechanism to design trading filters (index arb/program trading). • VaR - the efficient estimation of time varying covariance matrix also can be incorporated in VaR analysis.
Pricing Correlation Risk: ECM • Estimate a univariate GARCH model by including the ECM term in the mean and the variance equations
Pricing Correlation Risk:GARCH Correlations • Estimate a univariate GARCH model by including time varying correlations in the mean and the variance equations:
Hedging Correlation Risk • Estimate time varying hedge ratio • Dynamic hedging • Rebalance when expected correlation changes • Measure correlation over time and see if it is priced in the payoff/volatility • Examine correlation behavior during market drops and upturns –regime shifts—significant? • Measure correlation between volatilities • Measure sensitivity to changes in correlation and use linear hedging strategies –delta hedging
Hedging Correlation Risk: Instruments • Traditional risk management products • Spread options • Diversification strategy • Stress testing • Selecting flexible hedging instruments
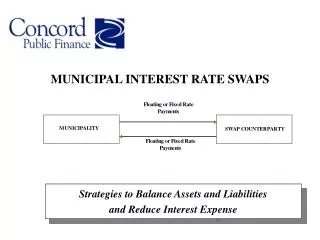
Correlation Risk in Interest Rate Swaps • Fixed-floating swap rates • Swap rates keyed off U.S.Treasury benchmark rates • Floating side is the 6m USD Libor • Swap rate reflects • future sequences of fixed and floating rates • uncertainty in changes in underlying interest rates • uncertainty regarding marked to market of swaps
Determinants of Swaps Spreads • Greenblatt (1995), Brown, et al (1994), Duffie and Singleton (1997), Cooper and Mello (1991), Brown, et al (1994), Evans and Parente-Bales (1991), Sun, Sundaresan and Wang (1993), and Liu, Longstaff and Mundell (2000) • swaps spread is a reward for bearing both liquidity and default risk • default risk is the largest component of the swap spread • liquidity of Treasury bonds have the greatest impact on changes in the swap spread • Minton (1997) • swaps spread as a portfolio of series of forward contracts and a portfolio of non-callable corporate bonds
Determinants of Swaps Spreads: Volatility ion Underlying Yield Curves • Brown, et al (1994) • increased uncertainty regarding the underlying yield curve increases the expected probability of default on existing swap contracts, which in turn leads to changes in the swap spread because changes in the interest rates may alter the option-like features embedded in the fixed side of the swap contract • the crucial link between swap spread and the volatility of the interest rates • Soresnon and Bolier (1994) • swap spreads respond to shape and the volatility of the yield curve because these factors affect the option value embedded in the replacement cost of the swap.
Determinants of Swaps Spreads: Volatility of the Underlying Yield Curve • Subramahnyam, Eom, and Uno (1998), Minton (1997), Brown et al (1994), Lekkos and Milas (2001), Duffie and Singleton (1997) • currency swap spreads are directly linked to the curvature (volatility) of the interest rate • interest rate swaps spreads respond to the slope of the yield curve, curvature of the yield curve.
Determinants of Swaps Spreads: Correlation • Since correlation is an important component of the joint volatility structure of two underlying interest rates, changes in the correlation offers information on the amount of uncertainty in the markets and therefore should affect the volatility of the swap spreads.
Determinants of Swaps Spreads: Parallel Shifts in Yield Curve • An unexpected increase in the fixed rate increases the market value of the swap for the fixed rate payer • An unexpected decline in the fixed interest rate increases the floating rate payer's savings • Parallel shift: If the rates are highly correlated, the economic value of swap contracts rises because there is less uncertainty.
Determinants of Swaps Spreads : Parallel Shifts in Yield Curve • There is more uncertainty in the swap market if the correlation is low because yield curve shifts would not be parallel. • Changes in the Treasury rate reflect macroeconomic conditions; changes in Libor reflect changes in the credit conditions; so these changes are not always synchronized.
Determinants of Swaps Spreads: Unmatched Swaps • Correlation risk also increases the dealer’s cost of hedging the book • dealers hedge their unmatched swaps using interest rate futures contracts • high correlation between interest rates implies better risk reduction by using these futures contracts; low correlation imply a reduction in the hedging effectiveness of these futures contracts • high correlation also reduces the uncertainty regarding marked-to-market of existing swaps
Empirical Results • Three swaps: 2yr, 5yr, and 10yr { 4/1/87 - 11/20/00} • Rates are non-stationary in the levels • Substantial leptokurtosis • Second moments are time varying • 3 multivariate GARCH models to derive time varying correlations • Plot
Empirical Results (contemporaneous correlation) • Estimate three univariate GARCH models with time varying correlation in both mean and conditional variance equations: • Model Mean Equation Variance Equation • Sign Significance Sign Significance • 2yr - NS - 1% • 5yr - NS - 1% • 10yr - NS - 5% • Robust (Bollerslev-Wooldridge heteroskedasticity consistent) estimates. Convergence level=.0005. NS: Not significant at 5%.
Empirical Results (lagged correlation) • Estimate three univariate GARCH models with time varying correlation in both mean and conditional variance equations: • Model Mean Equation Variance Equation • Sign Significance Sign Significance • 2yr + NS - 1% • 5yr + NS - 1% • 10yr - NS - 5% • Robust (Bollerslev-Wooldridge heteroskedasticity consistent) estimates. Convergence level=.0005. NS: Not significant at 5%.
Empirical Results (change in correlation) • Estimate three univariate GARCH models with time varying correlation in both mean and conditional variance equations: • Model Mean Equation Variance Equation • Sign Significance Sign Significance • 2yr - 1% - 1% • 5yr - 1% + 1% • 10yr - 1% + 1% • Robust (Bollerslev-Wooldridge heteroskedasticity consistent) estimates. Convergence level=.0005. NS: Not significant at 5%.
Conclusions • Adds another dimension to understanding the role of information in pricing and hedging financial assets. • Multivariate GARCH model allows us to examine the nature of the correlation over time and also factors that contribute to such time variations in the correlation.
Conclusions • Adds another dimension to understanding the role of information in pricing and hedging financial assets. • Multivariate GARCH model allows us to examine the nature of the correlation over time and also factors that contribute to such time variations in the correlation.
Conclusions • Adds another dimension to understanding the role of information in pricing and hedging financial assets. • Multivariate GARCH model allows us to examine the nature of the correlation over time and also factors that contribute to such time variations in the correlation.