Download
1 / 25
250 likes | 261 Views
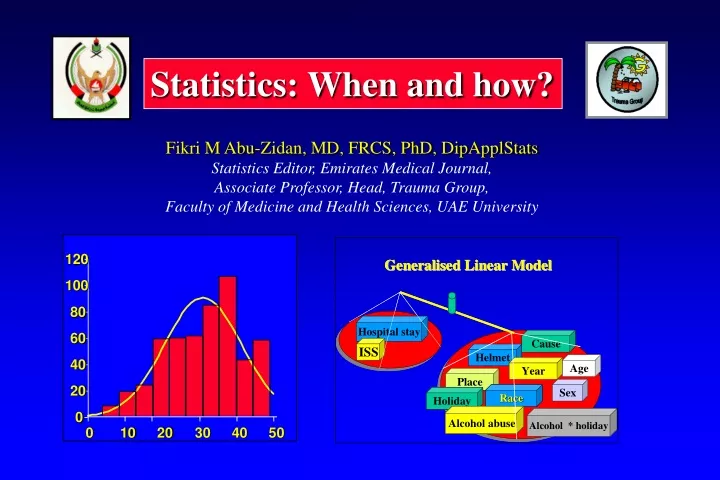
120. 100. 80. 60. 40. 20. 0. 0. 10. 20. 30. 40. 50. Statistics: When and how?. Fikri M Abu-Zidan, MD, FRCS, PhD, DipApplStats Statistics Editor, Emirates Medical Journal, Associate Professor, Head, Trauma Group, Faculty of Medicine and Health Sciences, UAE University.

E N D
120 100 80 60 40 20 0 0 10 20 30 40 50 Statistics: When and how? Fikri M Abu-Zidan, MD, FRCS, PhD, DipApplStats Statistics Editor, Emirates Medical Journal, Associate Professor, Head, Trauma Group, Faculty of Medicine and Health Sciences, UAE University
Statistics is a branch of mathematics dealing with the collection, analysis and interpretation of masses of numerical data. Merriam- Webster 1997 It is a tool to summarize and compare data in an informative way and not an aim by itself. It can not replace proper research questions. Fishing for questions to fit the data after analyzing it is erroneous.
Questions to be answered What is the objective of the analysis? Define the research question before starting the analysis What is the type of the data? How many groups are there? One group Two groups More than two groups Are the data normally distributed? If not, either transform data or use non parametric methods Are the groups related or unrelated?
Types of data Type Example Categorical data Color of the eye Binomial data Gender Ordinal Likert Scale Interval Weight
Conclusions depend on • Difference between the means • 2) Variability of the results Variance n x1 x x3 x2 x4 Variance: ∑ (x-x)2 n-1 x5 Standard deviation (SD) = xn SD Standard Error (SE) =
Group 2 Group 1 60 65 70 75 80 85 90 95 Weight (kg) Assumptions involved in t testing 1) Normal distribution 2) Same variability
68.26% 15.87% 15.87% +1 SD -1 SD 0
95 % 2.5 % 2.5 % +1.96 SD -1.96 SD 0
Females Males 150 155 160 165 170 175 180 185 Height (cm)
Males Females 150 155 160 165 170 175 180 185 Height (cm)
Males Sample size 100 10 2 1 160 165 170 175 180 185 190 Height (cm)
We would not expect the actual differences to be more than approximately 2 standard errors away from zero, assuming, of course, that the results follows a normal distribution. 95% of all non-genuine differences will lie between ± 2 standard errors.
Null hypothesis The two groups being compared are assumed the same until proven different. A large sample difference suggest a real difference is inherently more appealing than the remote (5%) (Type I error), p < 0.05 An innocent verdict does not necessarily mean that a jury is convinced of a defendant’s innocence. It may mean that the facts were not strong enough. (Type II error)
Two-tailed test Differences in either direction The standard way of comparison One-tailed test Decided before analysis Justified by the logic of comparison Clearly identified in report
Paired t-test Pairs can be formed on natural basis (twin) or on a more arbitrary artificial basis. Beware Do not analyze the results of a paired experiment using an independent t test. This ignores the paired nature of the results and loses the advantages of this very sensitive test.
Do not look through the p pinhole t = 8/2 = 4 P < 0.05 Placebo n=100 mean (SEM) 120 (2) mmHg New drug n=100 mean (SEM) 112 (2) mmHg
140 120 120 100 100 80 80 60 60 40 40 20 20 0 0 1 2 3 4 5 6 7 8 0 10 20 30 40 50 2 Mean Transformation Mean
** 60 ** 55 50 45 40 Amylin pM 35 30 25 20 15 10 Control Sham Ischaemia operated reperfusion
130 110 ** MAP mmHg 90 ** S group, n=10 IR group, n=10 70 50 20 40 60 80 0 Time (Minutes)
Report 1.The number of each group 2.The mean value of each group 3.The standard deviation of each group 4.The range of results 5.The calculated value of t 6.The degree of freedom involved 7.The type I error involved
Checklist What is the null hypothesis? What is the alternative hypothesis (two-tailed or one-tailed test) ? Are the two sets of results unrelated to one another? What is the critical value? 5 % if you are carrying out a two-tailed test 10% if you are carrying out a one-tailed test Does the t value exceeds the critical value?
Correlations 6.5 Spearman Rank Correlation 6 Average of 15 questions 5.5 r = 0.84 p = 0.0002 5 4.5 4 5 6 7 Overall rating