Download
1 / 16
160 likes | 256 Views
Detection of extremely low concentration of amino acids. Presented by Sam Y. Bae. Why Amino Acids?. They are basic building blocks of all living organisms. Traces of them prove existence of life, like on Mars, pursuit at JPL.

E N D
Detection of extremely low concentration of amino acids Presented by Sam Y. Bae
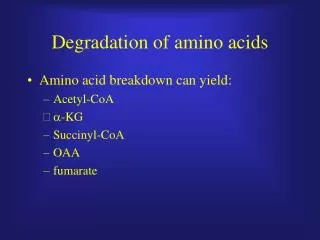
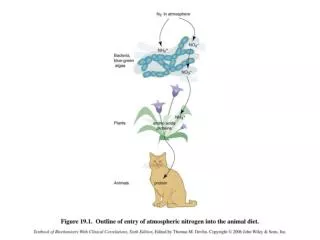
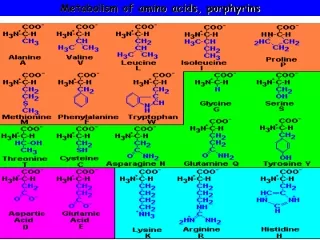
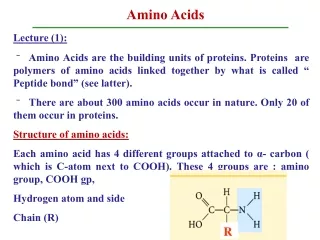
Why Amino Acids? • They are basic building blocks of all living organisms. • Traces of them prove existence of life, like on Mars, pursuit at JPL. • And, their metabolic activities can be correlated to diseases, pursuit at UCLA.
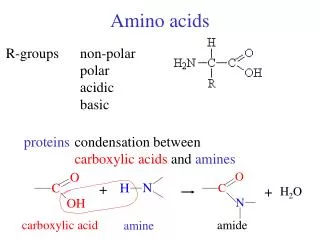
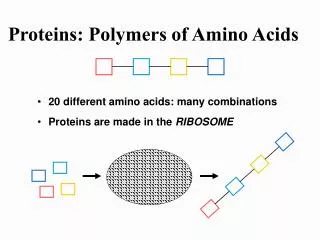
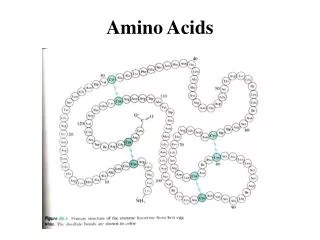
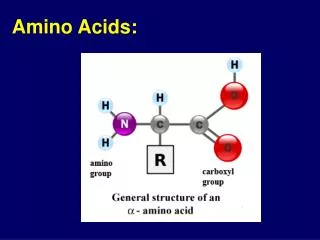
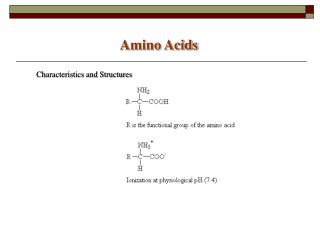
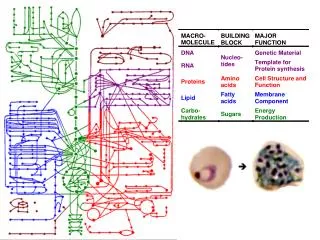
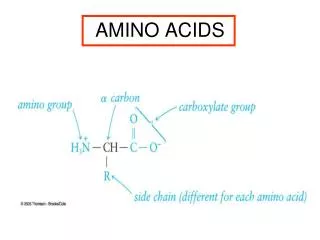
Little bit about amino acids • 20 amino acids and more. • Monomers polymers a 3D structure like enzymes, functioning unit, like a lock-and-key.
Specific Aim • 3D-Plot of extremely low concentration of amino acids, each axis having: separation-time, mass-to-charge ratio, and intensity. • Through coupling capillary electrophoresis and mass spectrometer
CE’s AA separation • Different size of AA are separated according to their Electrophoretic and Electrosmotic mobilities.
+νe + -νe νEOF - Theory - Cation is a vector sum ofνEOF +νe - Anion is a vector sum ofνEOF -νe - Neutral moves along withνEOF
Flourescamine LIF • Attach fluorescent molecule Time vs. intensity. • Below a typical electropherogram.
MS’ AA detection • Ionized particles deflected either by an electric field or magnetic field. • Amount of deflection determined by each particle’s m/z.
CE and MS Plot Combined! M/Z Time
So, I want to build an engineering system • Capillary electrophoresis coupled with a mass spectrometer—intermediated by a nano-Electropray ionization. This will enable detection of what were limitations in seeing low concentration molecules. • CE and MS are mature technologies; main development will be in fabrication of a nano-ES tip, which aerosolize analytes from/after a CE separation. • Lab-on-a-chip will add automation in directing fluid to different analytical chambers. (Contamination should be kept minimum for low concentration detection.)
Preliminary Results • Directing a sample through a Lab-on-a-chip • Simultaneous analysis on a chip • No human interference, minimum contamination
Nano-Electrospray Tip • On-chip nano-ES tip • Autonomous, eliminates manual assembly of nano-ES and CE Consistency, low contamination • Sheethless flow Precision spray volume • On-chip Minimum band broadening in separation • A successful nano-ES tip is • 30-micron diameter via that is: • Connected immediately end of a 0.4-mm CE capillary wafer • Has the same axial area as the capillary channel • Is made of the same material as the channel
To MS Aerosol Nano-ES Tip Glass substrate Metal covered at the tip to close circuit Axial Via +V– +V- Design • Fabrication of nano-ES tip is essential in coupling on-chip CE an MS.
Plans • Establish optimal geometry of LOC for mixing and analysis and run an artificially mixed solution in CZE. • Fabricate a nano-ES tip and establish sprayed ions’ current values. • Couple the chip to an MS. • Run amino acids