Download
1 / 28
280 likes | 357 Views
“Active” vs. “Passive” Management Good Governance = Managing Alpha and Beta. Dr. Arun Muralidhar. www.mcubeit.com. OPERS’ Investment Philosophy. Asset allocation is the key determinant of return Ranges will be maintained through a disciplined rebalancing program

E N D
“Active” vs. “Passive” Management Good Governance = Managing Alpha and Beta Dr. Arun Muralidhar www.mcubeit.com
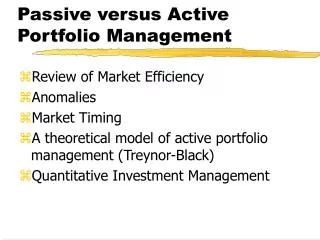
OPERS’ Investment Philosophy • Asset allocation is the key determinant of return • Ranges will be maintained through a disciplined rebalancing program • Diversification by and within asset class is the primary risk control element • Passive alternatives to actively managed portfolios are suitable investment strategies, especially in highly efficient markets OPERS Statement of Investment Objectives and Policies, June 2003; pg 5
Key Conclusions • Clients are separating “alpha” from “beta” - Too much alpha focus, not enough on the beta • Not enough focus on the impact versus liabilities • All portfolio decisions (including “passive” rebalancing) impact returns and risks; Must make decisions in an informed manner • Evaluate every decision in context of portfolio • The Greater Fool Theory of Asset Management
The Pension Fund Balance Sheet LIABILITIES Current Assets + = FutureContributions = + FutureReturns Funded ratio = assets/liabilities
Key to Success – Effective Decisions Set Objectives Determine Benchmark Outperform Benchmark Evaluate Performance Measure Risk Annual Monthly Monthly Daily • Traditional Approach – Alpha from External Managers • New Approach – Add Alpha from Informed Decisions • Governance/Oversight of Decisions - Transparency
Benchmark Misfit Risk Asset Allocation Decision Manager Selection and Allocation Portfolio: Many Embedded Decisions Total Portfolio/Liabilities Cash - 0% Equity - 64% Fixed Income - 23% Alternatives 13% Core HY Emerging Non US - 24% Dom. - 40% RE - 9% PE - 4% ACWI SC EMG LC SC Passive Active Important to manage/monitor each decision and understand individual and aggregate contribution to risk/return
The “Old” Active-Passive Framework • Strategic • Passive = Simple calendar or range-based rebalancing • True passive (Dutch model): benchmark includes drift until range is met or calendar period is completed • OPERS Policy Gives Discretion = Tracking Error • +/- 3% range for most assets; 4% for Real Estate • When range hit, go either to range or target or in-between
The “Old” Active-Passive Framework • Manager Level • Usually restricted to a tracking error budget • Usually with a single asset class focus • Optimize information ratio on active component • Developed a performance measure (M3) to show why this is incorrect (for single and multi-manager portfolios) • Could hire a negative IR manager!! Modigliani insight • Will not focus on today (See Appendix, pgs 24-27)
Passive Rebalancing: Can Be “Risky”* • OPERS Buy and Hold: 0.16% ann. Return; 1.09% tracking error; Worst drawdown = -2.15% over a multi-year period • +/-3% range for most assets; 4% for RE** • Impact: 0.01% annualized for 0.21% risk • Worst drawdown: much lower at –0.43% (multi-year period) • No transactions cost: 0.02% ann. (1% turnover) • On $ 60 bn = $90 mn/year impact, but lower risk! • Does not capture Asset-Liability risk or impact *Rebalancing was evaluated from 01/99 – 04/05. Only tested at the highest portfolio benchmark level. Proxied Lehman Universal with Lehman Composite and Custom Real Estate Index with NAREIT – data not provided by OPERS and hence can differ from true results. Transactions costs (one way) = 15 bps for equity; 10 bps for fixed income; 0.5% for alternatives **Range-based rebalancing = if any asset drifts to the range limit, all assets are rebalanced to benchmark
“Passive” Rebalancing: Not Cost/RiskNeutral Buy and Hold Rebalancing
Informed Decisions within Ranges • Portfolio rebalancing is an “active” decision • Pension funds experience cash flows – use them to structure fund appropriately • Asset class structuring also creates opportunity • Large cap vs. Small cap (+/-2%) • Core vs. HY vs. EMG (+/-2%) • EAFE vs. EMG vs. Small (+/-2%) Can OPERS staff use discretion to create value? Key is to have a robust, transparent, consistent process
Improving the Quality of Decisions • Institute consistent evaluation and performance metrics • Test variety of rules to use for specific decisions • Many resources can be tapped • Internal staff – have ideas that are unused • Research – lots of research on when asset classes do well • Leverage external managers/relationships – Verizon model • Transparency and process are key for good governance “Prudence is Process”
Portfolio: Focused on a Few Decisions Total Portfolio/Liabilities Asset Allocation - Equity vs Cash Asset Allocation - Equity vs FI Cash 0% Equity 64% Fixed Income 23% Alternatives 13% Fixed Income - Core vs HY Foreign 24% Domestic 40% Core HY Foreign Equity - ACWI vs EMG Domestic Equity - LC vs SC ACWI EMG LC SC Chose a few decisions to make the point Developed multiple rules to diversify the risk for each strategy
Informed Decisions/Managing Beta: Improved Risk/Return * • At highest level of fund, keep return (relative to “Buy and Hold”, lower risk relative to Rebalancing • Every decision is within passive rebalancing guidelines • Intelligent decisions contribute return at every level of fund – alpha can compound… Excess Annualized Tracking Information Worst Confidence Success Return Error Ratio Drawdown in Skill Ratio Asset Allocation level 0.16% 0.19% 0.81 -0.21% 98% 57% Domestic Equity 0.08% 0.19% 0.43 -0.35% 85% 55% Foreign Equity 0.04% 0.12% 0.36 -0.21% 82% 53% Fixed Income 0.04% 0.07% 0.57 -0.18% 92% 56% *All Decision regimes were evaluated from 01/99 – 04/05. Transactions costs were higher for sub-asset class level. Decision making frequency was monthly
Excess Annualized Tracking Information Worst Confidence Success Return Error Ratio Drawdown in Skill Ratio Buy and Hold 0.16% 1.09% 0.14 -2.19% 69% 51% Strict +/-3% Rebalancing 0.01% 0.21% 0.03 -0.43% 53% 42% Informed Decisions 0.32% 0.21% 1.5 -0.18% 99% 64% Comparing Impact on Entire Fund • At total fund level, can get better return with lower risk • Drawdown at total fund level is also lower • Translates into meaningful dollars = $180 million/year!
Managing Beta = “Alpha” ($) + Risk Management = Good Governance Informed Decisions Rebalancing
Informed Decisions can Lower A-L Risk • Showed another client how informed decisions can lower asset-liability risks beyond standard rebalancing • Similar liability target to OPERS (8% annualized) Annualized Liability Return (Benchmark) = 8.2% Note: These results are indicative and were obtained from another fund using the “informed decision” approach ( 2001-2005)
Summary • Can use current Statement of Objectives to add meaningful value from “managing beta” • Being “active” within “passive” range = good governance • Can also control risk in a meaningful way • Cheaper source of excess return at total fund return (than any other “alpha” option) • Easy to adopt by leveraging external relationships
Tracking error vs. excess returns (net of fees) US Equity Large Cap US Fixed Income 5 High Yield 4 Non-US Equity EAFE 3 Non-US Equity EAFE - Japan Lite Emg Mkt Equities 2 Excess return Non-US Fixed Income 1 US Equity Small Cap US Equity Mid Cap 0 Non-US Fixed -1 Income - Japan Lite 0 2 4 6 8 10 12 Tracking error Where Should a Fund Take Risk? • Consistent with OPERS philosophy – WHO IS THE MUG? From 12/87 to 12/97 Source: Muralidhar (2001), Innovations in Pension Fund Management
From 12/87 to 12/97 Average 6 4 2 Average (Gross) Excess returns 0 Average (Net) -2 -4 -6 0 2 4 6 8 10 12 14 Tracking error The Wilshire U.S. Large Cap Universe: Zero Average Alpha • Can OPERS beat the pack with a dynamic manager strategy? Source: Muralidhar (2001), Innovations in Pension Fund Management
Should managers be constrained? The case for conservative management Wilshire U.S. Fixed Income Universe From 12/87 to 12/97 2.0 1.5 1.0 Information ratio 0.5 0.0 -0.5 -1.0 0 1 2 3 4 5 6 Tracking error
The Greater Fool Theory of Asset Management • If average alpha is zero, must believe that another sponsor is selecting a bad manager…. • The average alpha in international came from a bet on Japan – will the future have another? • Does not negate the case for active management – need to be smart about “managing managers” • New performance measures give new insight on optimal portfolio construction (cash vs passive vs active)
An Evaluation of the M2 Measure Active portfolio Return Active portfolio Benchmark Riskless asset Standard deviation Market risk Standard deviation of active portfolio
An Underperforming Manager Has a Higher Risk-Adjusted Return!!! Return Benchmark Riskless asset Standard deviation Market risk Information ratio is a bad measure of performance!! M2 provides allocation information between cash and active manager
The M3-adjustment – Normalize for Tracking Error Standard Fund Return deviation r(RAP) TE(basic) TE(RAP) r(CAP) (%) (%) (%) (%) (%) (%) (1) (2) (3) (4) (6) (7) (8) (12) F 5.50 0.00 0.00 B 17.09 13.27 1.00 17.09 1 33.24 27.57 0.71 18.85 20.45 10.14 18.43 2 25.63 24.93 0.77 16.21 17.02 9.04 17.43 3 25.04 25.02 0.73 15.86 17.74 9.68 17.41 4 24.08 21.33 0.80 17.06 13.34 8.38 17.65 5 21.95 21.75 0.59 15.53 17.52 11.97 17.68 6 21.90 13.84 0.84 21.21 7.76 7.57 19.26 7 21.61 14.37 0.83 20.37 8.13 7.74 18.91 8 20.89 23.06 0.79 14.36 15.07 8.69 16.70 9 20.77 14.00 0.89 19.97 6.53 6.32 18.83 10 20.56 14.79 0.92 19.00 5.74 5.24 18.43 Get a totally different ranking of external managers
First 1 6 6 6 6 6 1 Second 2 9 7 9 7 7 6 Third 3 7 9 7 9 9 10 Fourth 4 10 10 10 1 1 9 Fifth 5 1 1 1 10 10 7 Sixth 6 4 4 4 5 5 4 Seventh 7 2 2 2 4 4 2 Eighth 8 3 3 3 2 2 3 Ninth 9 5 5 5 3 3 5 Tenth 10 8 8 8 8 8 8 M3 Gives Information on Allocation to Cash, Passive and Active Managers Skill using Information Skill using M2 or Skill using M2 M3 M3 ratio Ranking Unadjusted raw returns Sharpe (1) (2) (3) (4) (5) (6) (7) (8) Have shown that M3 is only measure consistent with skill-based rankings Can use same technique for multi-manager portfolios
Caveats and Disclaimers • Data was not provided by OPERS – we used our own and hence actual analysis by OPERS will differ. Data was used to make a hypothetical study of the fund to show the impact of different investment options and was not meant to be an investment recommendation. • We have developed some intelligent allocation rules across various asset classes and sub-asset classes. These are purely research ideas, tapped from publicly available research, and there is no guarantee that they will generate performance in the future for OPERS. • We have attempted to use very onerous transaction costs assumptions to see if these ideas would still be beneficial. Again, OPERS’ own experience will differ because of the size of the fund and other institutional constraints.