Download
1 / 8
80 likes | 169 Views
Estimating Total Phosphorous and Total Suspended Solids in Freshwater Streams from Turbidity Data. Emily Saad EAS 4480 Oral Presentation 27 April 2010. Background. Study Site: Little Bear River (Northern Utah) Drains into Cutler Reservoir Eutrophic hypoxic due to high phosphorous levels

E N D
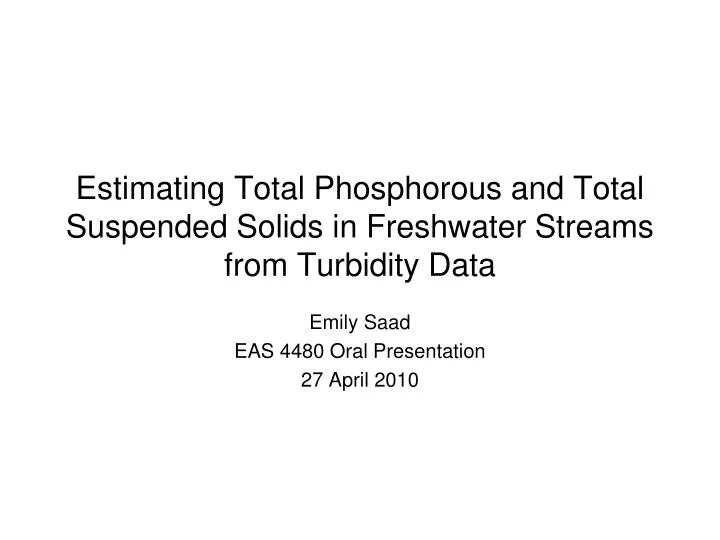
Estimating Total Phosphorous and Total Suspended Solids in Freshwater Streams from Turbidity Data Emily Saad EAS 4480 Oral Presentation 27 April 2010
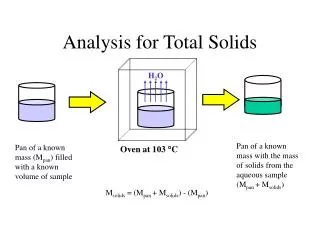
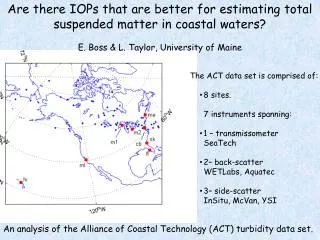
Background • Study Site: • Little Bear River (Northern Utah) • Drains into Cutler Reservoir • Eutrophic hypoxic due to high phosphorous levels • TMDL established in reservoir’s tributaries • .05 mg/L • Not yet met by Little Bear • Paradise (upper watershed) and Mendon (lower watershed) • Data Collection • High Frequency: In situ sensors • Physical parameters • Water level, temperature, pH, conductivity, DO, turbidity • Some chemical species (recent technology using UV/Vis) • NO3-, NO2-, chlorophyll • Infrequent: Grab Sampling • Short term variability, diurnal trends omitted • TP digested and analyzed in lab • Surrogate Measurements • Objective • In situ turbidity as a surrogate for more accurate estimation of TP concentrations and TSS
p< .05 r= .95 p<.05 r= .84 p< .05 r= .69 p<.05 r= .95
Model Used to Simulate TP and TSS -all based on linear regression -y=a0+a1x1+Z(B0+B1x1)+ei - the probability plot of the residuals are not normally distributed suggesting that the assumed parametric distribution (normal) in the regression is incorrect Jones, et al. (2008)
Bootstrap Analyses: TSS @ PAR TP @ PAR 9.6E-5±1.9E-4 6.1E-5± 3.3E-4 13.8±.11 .027± 7.8E-5 TP @ MEN TSS @ MEN -.044±.052 -.12± .03 .13±.004 48.4±1.03
Bootstrap Regression: Simulated vs. Observed
Conclusions -TP and TSS both significantly correlated with turbidity as these sites -re-evaluate model not assuming normal distributions Jones, et al. (2008).