Download
1 / 55
550 likes | 649 Views
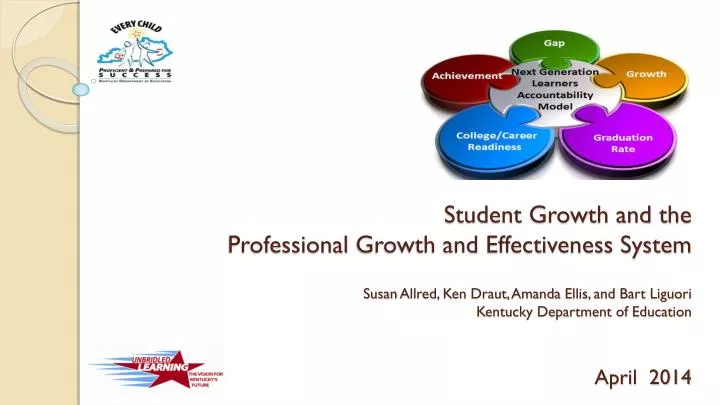
Student Growth and the Professional Growth and Effectiveness System Susan Allred, Ken Draut, Amanda Ellis, and Bart Liguori Kentucky Department of Education April 2014. Unbridled Learning: Next-Generation Accountability Model. Next Generation Learner Achievement Gap Growth (SGP)

E N D
Student Growth and the Professional Growth and Effectiveness SystemSusan Allred, Ken Draut, Amanda Ellis, and Bart LiguoriKentucky Department of EducationApril 2014
Unbridled Learning: Next-Generation Accountability Model • Next Generation Learner • Achievement • Gap • Growth (SGP) • College/Career Readiness • Graduation Rate • Next Generation Instructional Programs and Support • Program Reviews • Arts/Humanities • Practical Living/Career Studies • Writing • Primary/World Languages • Next Generation Professionals • Teachers and Leaders KDE:OAA:3/28/2014:kd:rls
Next-Generation Learners Accountability SystemStudent Growth Percentile (SGP)
Traditional Growth • Traditional picture of growth is getting a score on a student and then re-testing the student to see how he/she improved. • Example: Addition – One Digit Numbers • A student takes 20 multiple-choice (MC) questions on the first test and gets 8 correct. • A week later the student takes another 20 MC question test and now gets 18 correct. • We can say the student grew in his/her knowledge of adding one digit numbers. KDE:OAA:3/28/2014:kd:rls
Traditional Growth • Formative and interim assessments work very well with the traditional view of growth. • Focus on a select subject • Use lots of items to measure the skill • Show improvement since items are alike KDE:OAA:3/28/2014:kd:rls
Problems with Traditional Growth in Summative Assessments • Once-a-year summative assessments have some problems with this traditional view. • Cover a broader set of objectives • Use fewer items to measure an objective • Are administered once a year KDE:OAA:3/28/2014:kd:rls
Growth Models • Student Growth Percentile • Gain Score • Trajectory • Categorical • Residual Gain • Projection • Multivariate KDE:OAA:3/28/2014:kd:rls
Student Growth Percentile (SGP) Model • SGP measures change in an individual student’s performance over time. • How much did John improve in mathematics from grade 4 to grade 5 can be answered by showing: • How well John improved from grade 4 to 5 compared to his academic peers. KDE:OAA:3/28/2014:kd:rls
Student Growth PercentileKey Points • Each student’s rate of change is compared to other students with a similar test score history (“academic peers”). • The rate of change is expressed as a percentile. • How much did John improve in mathematics from grade 4 to grade 5, relative to his academic peers? • If John improved more than 65 percent of his academic peers, then his student growth percentile would be 65. KDE:OAA:3/28/2014:kd:rls
Student Growth PercentileKey Points • Focuses on the relative standing of a student from year to year compared to the student’s academic peers. • The academic peers are students who perform very similarly to the student on the test. The student is only compared to students who start at the same place. • In year two, the question is: Did the student outpace his peer group? KDE:OAA:3/28/2014:kd:rls
Student Growth Percentile (SGP) • Students who outpaced their peer group would be in the percentile ranks of 50 – 99. • Students who underperformed their peer group would be in the percentile ranks of 1 – 49. • In Kentucky, though, the acceptable rank for growth is the 40th percentile. • Students who score at the 40th percentile or higher are considered to have typical or higher annual growth. KDE:OAA:3/28/2014:kd:rls
Student Growth Percentile (SGP)Requirements • Must have two test scores from two different years for each student. • Tests must be in same subject. • In Kentucky only Reading and Mathematics are tested each year from grades 3-8. • High schools will use PLAN (grade 10) and ACT (grade 11) scores in Reading and Mathematics. KDE:OAA:3/28/2014:kd:rls
Student Growth Percentile (SGP) • SGP is a way to measure progress for students at all performance levels. • SGP provides evidence of improvement even among those with low achievement. • SGP gives high achieving students and schools something to strive for beyond proficiency. KDE:OAA:3/28/2014:kd:rls
Student Growth Percentile Kentucky Classroom Mrs. Smith Grade 5 KDE:OAA:3/28/2014:kd:rls
Mrs. Smith—Grade 5 Classroom Beginning of Year Incoming Mathematics Scale Scores 201 220 185 222 187 193 208 203 197 210 195 219 Grade 4 231 188 196 185 194 218 196 205 213 199 200 Grade 4 KDE:OAA:3/28/2014:kd:rls
Academic Peer Group (Statewide) Students Scoring at 210 on Grade 4 Mathematics 210 210 210 210 210 210 210 210 210 210 210 210 210 210 210 210 Mrs. Smith’s Grade 5 Student KDE:OAA:3/28/2014:kd:rls
Academic Peer Group (Statewide) Grade 5 Mathematics Scale Scores for Grade 4 “210” Group 210 210 210 210 210 210 210 210 210 Grade 4 210 210 210 215 200 213 213 209 218 214 211 213 204 212 221 Grade 5 … Grade 4 210 210 210 210 210 210 210 210 210 210 210 210 216 220 227 214 213 210 212 211 213 214 199 221 Grade 5 KDE:OAA:3/28/2014:kd:rls
Rank Ordered Grade 4 Mathematics “210” Academic Peer Group Based on Grade 5 Mathematics Score 210 210 210 210 210 210 210 210 210 Grade 4 210 210 210 199 204 209 210 211 212 212 213 213 Grade 5 200 211 213 Student is at the 70th Percentile Grade 4 210 210 210 210 210 210 210 210 210 210 210 210 Grade 5 213 213 214 214 214 215 216 218 220 227 213 221 KDE:OAA:3/28/2014:kd:rls
Student Summary • Grade 4 Mathematics Score is 210. • Grade 5 Mathematics Score is 215. Mrs. Smith’s Grade 5 Student • The student outpaces 70% of the statewide Academic Peer Group. • The student’s SGP is 70. KDE:OAA:3/28/2014:kd:rls
Mrs. Smith—Grade 5 Classroom SGP for Each Student Based on Grade 5 Mathematics Test SGP 70 92 85 65 57 52 51 47 46 55 53 49 SGP 23 19 40 32 21 44 43 41 42 38 26 KDE:OAA:3/28/2014:kd:rls
State Accountability Use of SGP Elementary Accountability Calculation: 76% (students at 40 or higher SGP) X 40% Weight = 30.4 Points Earned for Growth Component of Unbridled Learning KDE:OAA:3/28/2014:kd:rls
Theoretical Premise: When students with “like” scores are placed in an academic peer group and then compared one year later, we assume teacher and school actions happened between the two tests to cause a student to stay even with or out- perform the academic peer group. The actions may include instruction, curriculum, on-going assessments, etc. KDE:OAA:3/28/2014:kd:rls
Unbridled Learning: Next-Generation Accountability Model • Next Generation Learner • Achievement • Gap • Growth • College/Career Readiness • Graduation Rate • Next Generation Instructional Programs and Support • Program Reviews • Arts/Humanities • Practical Living/Career Studies • Writing • Primary/World Languages SGP • Next Generation Professionals • Teachers and Leaders KDE:OAA:3/28/2014:kd:rls
Next Generation ProfessionalsUse of Student Growth Percentiles (SGP) to determine Teacher Effectiveness
Student Growth • Two types of Student Growth will factor into a teacher’s overall Student Growth Rating: • Local Student Growth Goals (all teachers) • State Student Growth Percentiles (approximately 20% of teachers) KDE:OAA:3/28/2014:kd:rls
Student Growth Percentiles • Available for teachers of students in grades 4-8 who take K-PREP in Reading and/or Math • Not available for Grade 11 (PLAN-ACT) for teacher effectiveness because there may be more than one teacher impacting that student’s growth KDE:OAA:3/28/2014:kd:rls
Teacher Student Growth Percentile • Median Student Growth Percentiles are used. • Up to three years of data are combined. • Math and Reading scores are combined. • A minimum number of 10 students are required to receive SGP. • Attribution is determined at the local level. • It is a lagging indicator (will not be available until the next fall). KDE:OAA:3/28/2014:kd:rls
Mrs. Smith—Grade 5 Classroom SGP for Each Student Based on 2014 Grade 5 Mathematics Test SGP 70 92 85 65 57 52 51 47 46 55 53 49 Mrs. Smith’s Median Math SGP=46 SGP 23 19 40 32 21 44 43 41 42 38 26 KDE:OAA:3/28/2014:kd:rls
Mrs. Smith—Grade 5 Classroom SGP for Each Student Based on 2014 Grade 5 Reading Test SGP 70 89 81 69 68 60 59 53 52 67 63 53 Mrs. Smith’s Median Reading SGP=52 SGP 23 13 39 32 15 49 48 41 42 38 26 KDE:OAA:3/28/2014:kd:rls
Mrs. Smith—Grade 5 Classroom SGP for All 23 Students in Math and Reading 69 68 59 67 55 60 81 70 65 63 59 58 92 89 85 57 70 SGP Median SGP for Mrs. Smith = (51+49)/2= 50 SGP 53 46 53 49 53 52 47 52 51 44 43 42 SGP 23 38 23 13 41 41 21 15 42 40 40 32 26 19 38 32 26 KDE:OAA:3/28/2014:kd:rls
Student Growth Rating • Teachers will receive one of 3 ratings on their overall student growth: Low, Expected, or High. • For research purposes median student growth percentiles were calculated for all teachers statewide. • Using the distribution of median student growth percentiles, cutoffs were created to indicate Low, Expected, and High Student Growth. KDE:OAA:3/28/2014:kd:rls
Rationale for Ratings • The mean Teacher SGP score was 47. • Expected Student Growth should constitute approximately 2/3 of teachers. • Cut scores for Low, Expected and High were determined using the distribution of median SGPs for teachers. KDE:OAA:3/28/2014:kd:rls
Distribution of Teachers’ SGPs 18.1% of all Teachers 66.6% of all Teachers 15.3% of all Teachers Low Expected High KDE:OAA:3/28/2014:kd:rls
Student Growth Percentile Ratings KDE:OAA:3/28/2014:kd:rls
What was Mrs. Smith’s Rating? • Mrs. Smith had a median SGP of 50; therefore, she would have a state student growth rating of Expected. • Up to 3 years of Data and Math/Reading Scores can be used. KDE:OAA:3/28/2014:kd:rls
Student Growth Goals • Assumptions around local contributions to student growth • Foundations of the work in Kentucky • Research base • Connections to KCAS and PGES • Key features of student growth • Lessons learned from deep-dive districts • Voices from the field – PANEL DISCUSSION • Supports for districts
Student Growth Assumptions and Misconceptions • Accountability improves educator performance. • Growth is measured over time. • The expectation must be consistent for all teachers. • Accountability is imposed on teachers. • Equity requires comparability. • Comparable means “the same”. • We’ve built it… we’re done!
Essential Conditions for Success Kentucky’s Foundation: • Classroom Assessment for Student Learning (CASTL) • Senate Bill 1 - 2009 • Leadership Networks • Assessment Literacy • Math Design Collaborative/Literacy Design Collaborative • Program Reviews Home / Teachers/Leaders / Professional Growth and Effectiveness System (PGES) / Student Growth
Essential Conditions for Success Home / Teachers/Leaders / Effective Teachers / PGES Research The Research: The Core
Essential Conditions for Success Home / Teachers/Leaders / Professional Growth and Effectiveness System (PGES) / Student Growth The Research: Student Growth Specific
KCAS and PGES Home / Teachers/Leaders / Professional Growth and Effectiveness System (PGES) / Student Growth Balancing Policy and Practice
KCAS and PGES Home / Teachers/Leaders / Professional Growth and Effectiveness System (PGES) / Student Growth Comparability and Rigor
KCAS and PGES Home / Teachers/Leaders / Professional Growth and Effectiveness System (PGES) / Student Growth Enduring Skills and Content
Key Features of Student Growth Goals Home / Teachers/Leaders / Professional Growth and Effectiveness System (PGES) / Student Growth Think and Plan
Key Features of Student Growth Goals Home / Teachers/Leaders / Professional Growth and Effectiveness System (PGES) / Student Growth Examples and Non-Examples
Sub Skill Strategy Disposition