Download

1 / 45
450 likes | 590 Views
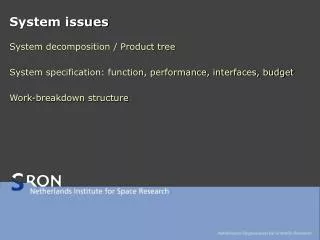
Storage System Issues. Designing an I/O System ABCs of UNIX File Systems I/O Benchmarks Comparing UNIX File System Performance. Designing an I/O System. When designing an I/O system, the components that make it up should be balanced. Six steps for designing an I/O systems are

E N D
Storage System Issues • Designing an I/O System • ABCs of UNIX File Systems • I/O Benchmarks • Comparing UNIX File System Performance
Designing an I/O System • When designing an I/O system, the components that make it up should be balanced. • Six steps for designing an I/O systems are • List types of devices and buses in system • List physical requirements (e.g., volume, power, connectors, etc.) • List cost of each device, including controller if needed • Record the CPU resource demands of device • CPU clock cycles directly for I/O (e.g. initiate, interrupts, complete) • CPU clock cycles due to stalls waiting for I/O • CPU clock cycles to recover from I/O activity (e.g., cache flush) • List memory and I/O bus resource demands • Assess the performance of the different ways to organize these devices
Example: Determining the I/O Bottleneck • Assume the following system components: • 500 MIPS CPU • 16-byte wide memory system with 100 ns cycle time • 200 MB/sec I/O bus • 20 20 MB/sec SCSI-2 buses, with 1 ms controller overhead • 5 disks per SCSI bus: 8 ms seek, 7,200 RPMS, 6MB/sec • Other assumptions • All devices used to 100% capacity, always have average values • Average I/O size is 16 KB • OS uses 10,000 CPU instr. for a disk I/O • What is the average IOPS? What is the average bandwidth?
Example: Determining the I/O Bottleneck • The performance of I/O systems is determined by the portion with the lowest I/O bandwidth • CPU : (500 MIPS)/(10,000 instr. per I/O) = 50,000 IOPS • Main Memory : (16 bytes)/(100 ns x 16 KB per I/O) = 10,000 IOPS • I/O bus: (200 MB/sec)/(16 KB per I/O) = 12,500 IOPS • SCSI-2: (20 buses)/((1 ms + (16 KB)/(20 MB/sec)) per I/O) = 11,120 IOPS • Disks: (100 disks)/((8 ms + 0.5/(7200 RPMS) + (16 KB)/(6 MB/sec)) per I/0) = 6,700 IOPS • In this case, the disks limit the I/O performance to 6,700 IOPS • The average I/O bandwidth is • 6,700 IOPS x (16 KB/sec) = 107.2 MB/sec
OS Policies and I/O Performance • Performance potential determined by HW: CPU, Disk, bus, memory system. • Operating system policies can determine how much of that potential is achieved. • OS Policies: 1) How much main memory allocated for file cache? 2) Can boundary change dynamically? 3) Write policy for disk cache. • Write Through with Write Buffer • Write Back
Network Attached Storage Decreasing Disk Diameters 14" » 10" » 8" » 5.25" » 3.5" » 2.5" » 1.8" » 1.3" » . . . high bandwidth disk systems based on arrays of disks High Performance Storage Service on a High Speed Network Network provides well defined physical and logical interfaces: separate CPU and storage system! Network File Services OS structures supporting remote file access 3 Mb/s » 10Mb/s » 50 Mb/s » 100 Mb/s » 1 Gb/s » 10 Gb/s networks capable of sustaining high bandwidth transfers Increasing Network Bandwidth
ABCs of UNIX File Systems • Key Issues • File vs. Raw I/O • File Cache Size Policy • Write Policy • Local Disk vs. Server Disk • File vs. Raw: • File system access is the norm: standard policies apply • Raw: alternate I/O system to avoid file system, used by data bases • File Cache Size Policy • Files are cached in main memory, rather than being accessed from disk • With older UNIX, % of main memory dedicated to file cache is fixed at system generation (e.g., 10%) • With new UNIX % of main memory for file cache varies depending on amount of file I/O (e.g., up to 80%)
ABCs of UNIX File Systems • Write Policy • File Storage should be permanent; either write immediately or flush file cache after fixed period (e.g., 30 seconds) • Write Through with Write Buffer • Write Back • Write Buffer often confused with Write Back • Write Through with Write Buffer, all writes go to disk • Write Through with Write Buffer, writes are asynchronous, so processor doesn’t have to wait for disk write • Write Back will combine multiple writes to same page; hence can be called Write Cancelling
ABCs of UNIX File Systems • Local vs. Server • Unix File systems have historically had different policies (and even file systems) for local client vs. remote server • NFS local disk allows 30 second delay to flush writes • NFS server disk writes through to disk on file close • Cache coherency problem if allow clients to have file caches in addition to server file cache • NFS just writes through on file closeStateless protocol: periodically get new copies of file blocks • Other file systems use cache coherency with write back to check state and selectively invalidate or update
remote accesses local accesses Network File Systems
Typical File Server Architecture • Limits to performance: data copying • Read data staged from device to primary memory • Copy again into network packet templates • Copy yet again to network interface • Normally no special hardware for fast processing between network and disk.
I/O buffers UNIX frontend manages 10 SCSI channels specialized for protocol processing dedicated FS software AUSPEX NS5000 File Server • Special hardware/software architecture for high • performance NFS I/O • Functional multiprocessing
AUSPEX Software Architecture Limited control interfaces Primary control flow Primary data flow
Berkeley RAID-II Disk Array File Server to UltraNet Low latency transfers mixed with high bandwidth transfers Application area: "Diskless Supercomputers" to 120 disk drives
I/O Performance Metrics: Throughput: • Throughput is a measure of speed—the rate at which the storage system delivers data. • Throughput is measured in two ways: • I/O rate, measured in accesses/second: • I/O rate is generally used for applications where the size of each request is small, such as transaction processing • Data rate, measured in bytes/second or megabytes/second (MB/s). • Data rate is generally used for applications where the size of each request is large, such as scientific applications.
I/O Performance Metrics: Response time • Response time measures how long a storage system takes to access data. This time can be measured in several ways. For example: • One could measure time from the user’s perspective, • the operating system’s perspective, • or the disk controller’s perspective, depending on what you view as the storage system.
I/O Performance Metrics Capacity: • How much data can be stored on the storage system. • Capacity is not normally applied as a metric to non-storage components of a computer system, but it is an integral part of evaluating an I/O system. Reliability: • I/O systems require a reliability level much higher than other parts of a computer. • If a memory chip develops a parity error, the system will (hopefully) crash and be restarted. • If a storage device develops a parity error in a database of bank accounts, however, bankscould unwittingly lose billions of dollars. Thus, reliability is a metric of great importance to storage COST: • Applies to all components in computer systems. • Disk subsystems are often the most expensive component in a large computer installation.
I/O Benchmarks • Processor benchmarks classically aimed at response time for fixed sized problem. • I/O benchmarks typically measure throughput, possibly with upper limit on response times (or 90% of response times) • Traditional I/O benchmarks fix the problem size in the benchmark. • Examples: Benchmark Size of Data % Time I/O Year I/OStones 1 MB 26% 1990 Andrew 4.5 MB 4% 1988 • Not much I/O time in benchmarks • Limited problem size • Not measuring disk (or even main memory)
The Ideal I/O Benchmark • An I/O benchmark should help system designers and users understand why the system performs as it does. • The performance of an I/O benchmark should be limited by the I/O devices. to maintain the focus of measuring and understanding I/O systems. • The ideal I/O benchmark should scale gracefully over a wide range of current and future machines, otherwise I/O benchmarks quickly become obsolete as machines evolve. • A good I/O benchmark should allow fair comparisons across machines. • The ideal I/O benchmark would be relevant to a wide range of applications. • In order for results to be meaningful, benchmarks must be tightly specified. Results should be reproducible by general users; optimizations which are allowed and disallowed must be explicitly stated.
Self-scalingI/O Benchmarks • Alternative to traditional I/O benchmarks: self-scaling I/O benchmarks; automatically and dynamically increase aspects of workload to match characteristics of system measured • Measures wide range of current & future applications • Types of self-scaling benchmarks: • Transaction Processing - Interested in IOPS not bandwidth • TPC-A, TPC-B, TPC-C • NFS: SPEC SFS/ LADDIS - average response time and throughput. • Unix I/O - Performance of files systems • Willy
I/O Benchmarks: Transaction Processing • Transaction Processing (TP) (or On-line TP=OLTP) • Changes to a large body of shared information from many terminals, with the TP system guaranteeing proper behavior on a failure • If a bank’s computer fails when a customer withdraws money, the TP system would guarantee that the account is debited if the customer received the money and that the account is unchanged if the money was not received • Airline reservation systems & banks use TP • Atomic transactions makes this work • Each transaction => 2 to 10 disk I/Os & 5,000 and 20,000 CPU instructions per disk I/O • Efficiency of TP SW & avoiding disks accesses by keeping information in main memory • Classic metric is Transactions Per Second (TPS) • Under what workload? how machine configured?
I/O Benchmarks: Old TPC Benchmarks • TPC-A: Revised version of TP1/DebitCredit • Arrivals: Random (TPC) vs. uniform (TP1) • Terminals: Smart vs. dumb (affects instruction path length) • ATM scaling: 10 terminals per TPS vs. 100 • Branch scaling: 1 branch record per TPS vs. 10 • Response time constraint: 90% Š2 seconds vs. 95% Š1 • Full disclosure, approved by TPC • Complete TPS vs. response time plots vs. single point • TPC-B: Same as TPC-A but without terminals—batch processing of requests • Response time makes no sense: plots tps vs. residence time (time of transaction resides in system) • These have been withdrawn as benchmarks
I/O Benchmarks: TPC-C Complex OLTP • Models a wholesale supplier managing orders. • Order-entry conceptual model for benchmark. • Workload = 5 transaction types. • Users and database scale linearly with throughput. • Defines full-screen end-user interface • Metrics: new-order rate (tpmC) and price/performance ($/tpmC) • Approved July 1992
TPC-C Price/Performance $/tpm(c) Rank Config $/tpmC tpmC Database 1 Acer AcerAltos 19000Pro4 $27.25 11,072.07 M/S SQL 6.5 2 Dell PowerEdge 6100 c/s $29.55 10,984.07 M/S SQL 6.5 3 Compaq ProLiant 5500 c/s $33.37 10,526.90 M/S SQL 6.5 4 ALR Revolution 6x6 c/s $35.44 13,089.30 M/S SQL 6.5 5 HP NetServer LX Pro $35.82 10,505.97 M/S SQL 6.5 6 Fujitsu teamserver M796i $37.62 13,391.13 M/S SQL 6.5 7 Fujitsu GRANPOWER 5000 Model 670 $37.62 13,391.13 M/S SQL 6.5 8 Unisys Aquanta HS/6 c/s $37.96 13,089.30 M/S SQL 6.5 9 Compaq ProLiant 7000 c/s $39.25 11,055.70 M/S SQL 6.5 10 Unisys Aquanta HS/6 c/s $39.39 12,026.07 M/S SQL 6.5
I/O Benchmarks: TPC-D Complex Decision Support Workload • OLTP: business operation • Decision support: business analysis (historical) • Workload = 17 adhoc transaction types • Synthetic generator of data • Size determined by Scale Factor: 100 GB, 300 GB, 1 TB, 3 TB, 10 TB • Metrics: “Queries per Gigabyte Hour” Power (QppD@Size) = 3600 x SF / Geo. Mean of queriesThroughput (QthD@Size) = 17 x SF / (time/3600)Price/Performance ($/QphD@Size) = $/ geo. mean(QppD@Size, QthD@Size) • Report time to load database (indices, stats) too. • Approved April 1995
TPC-D Performance/Price 300 GB Rank Config. Qppd QthD $/QphD Database 1 NCR WorldMark 5150 9,260.0 3,117.0 2,172.00 Teradata 2 HP 9000 EPS22 (16 node) 5,801.2 2,829.0 1,982.00 Informix-XPS 3 DG AViiON AV20000 3,305.81,277.7 1,319.00 Oracle8 v8.0.4 4 Sun - Ultra Enterprise 6000 3,270.61,477.8 1,553.00 Informix-XPS 5 Sequent NUMA-Q 2000 (32 way) 3,232.3 1,097.8 3,283.00 Oracle8 v8.0.4 Rank Config. Qppd QthD $/QphD Database 1 DG AViiON AV20000 3,305.8 1,277.7 1,319.00 Oracle8 v8.0.4 2 Sun Ultra Enterprise 6000 3,270.6 1,477.8 1,553.00 Informix-XPS 3 HP 9000 EPS22 (16 node) 5,801.2 2,829.0 1,982.00 Informix-XPS 4 NCR WorldMark 5150 9,260.0 3,117.0 2,172.00 Teradata 5 Sequent NUMA-Q 2000 (32 way) 3,232.3 1,097.8 3,283.00 Oracle8 v8.0.4
TPC-D Performance 1TB Rank Config. Qppd QthD $/QphD Database 1 Sun Ultra E6000 (4 x 24-way) 12,931.9 5,850.3 1,353.00 Infomix Dyn 2 NCR WorldMark (32 x 4-way) 12,149.23,912.3 2103.00 Teradata 3 IBM RS/6000 SP (32 x 8-way) 7,633.05,155.4 2095.00 DB2 UDB, V5 • NOTE: Inappropriate to compare results from different database sizes.
I/O Benchmarks: TPC-W Transactional Web Benchmark • Represent any business (retail store, software distribution, airline reservation, electronic stock trades, etc.) that markets and sells over the Internet/ Intranet • Measure systems supporting users browsing, ordering, and conducting transaction oriented business activities. • Security (including user authentication and data encryption) and dynamic page generation are important • Before: processing of customer order by terminal operator working on LAN connected to database system • Today: customer accesses company site over Internet connection, browses both static and dynamically generated Web pages, and searches the database for product or customer information. Customer also initiate, finalize and check on product orders and deliveries. • Approved Fall, 1998
SPEC SFS/LADDIS Predecessor: NFSstones • NFSStones: synthetic benchmark that generates series of NFS requests from single client to test server: reads, writes, & commands & file sizes from other studies. • Problem: 1 client could not always stress server. • Files and block sizes not realistic. • Clients had to run SunOS.
SPEC SFS/LADDIS • 1993 Attempt by NFS companies to agree on standard benchmark: Legato, Auspex, Data General, DEC, Interphase, Sun. • Like NFSstones but: • Run on multiple clients & networks (to prevent bottlenecks) • Same caching policy in all clients • Reads: 85% full block & 15% partial blocks • Writes: 50% full block & 50% partial blocks • Average response time: 50 ms • Scaling: for every 100 NFS ops/sec, increase capacity 1GB. • Results: plot of server load (throughput) vs. response time & number of users • Assumes: 1 user => 10 NFS ops/sec
Unix I/O Benchmarks: Willy • UNIX File System Benchmark that gives insight into I/O system behavior (Chen and Patterson, 1993) • Self scaling to automatically explore system size • Examines five parameters • Unique bytes touched: data size; locality via LRU • Gives file cache size • Percentage of reads: %writes = 1 – % reads; typically 50% • 100% reads gives peak throughput • Average I/O Request Size: Bernoulli, C=1 • Percentage sequential requests: typically 50% • Number of processes: concurrency of workload (number processes issuing I/O requests) • Fix four parameters while vary one parameter • Searches space to find high throughput
UNIX File System Performance Study Using Willy 9 Machines & OS Machine OS Year Price Memory Alpha AXP 3000/400 OSF/1 1993 $30,000 64 MB DECstation 5000/200 Sprite LFS 1990 $20,000 32 MB DECstation 5000/200 Ultrix 4.2 1990 $20,000 32 MB HP 730 HP/UX 8 & 9 1991 $35,000 64 MB IBM RS/6000/550 AIX 3.1.5 1991 $30,000 64 MB SparcStation 1+ SunOS 4.1 1989 $30,000 28 MB SparcStation 10/30 Solaris 2.1 1992 $20,000 128 MB Convex C2/240 Convex OS 1988 $750,0001024 MB IBM 3090/600J VF AIX/ESA 1990 $1,000,000 128 MB Desktop Mini/Mainframe
Disk Performance • I/O limited by weakest link in chain from processor to disk • Could be disks, disk controller, I/O bus, CPU/Memory bus, CPU, or OS - not uniform across machines Machine OS I/O bus Disk Alpha AXP 3000/400 OSF/1 TurboChannel SCSI RZ26 DECstation 5000/200 Sprite LFS SCSI-I 3 CDC Wren DECstation 5000/200 Ultrix 4.2 SCSI-I DEC RZ56 HP 730 HP/UX 8 & 9 Fast SCSI-II HP 1350SX IBM RS/6000/550 AIX 3.1.5SCSI-I IBM 2355 SparcStation 1+ SunOS 4.1 SCSI-I CDC Wren IV SparcStation 10/30 Solaris 2.1 SCSI-I Seagate Elite Convex C2/240 Convex OS IPI-2 4 DKD-502 IBM 3090/600J VF AIX/ESA Channel IBM 3390
Disk Performance • 32 KB reads • SS 10 disk spins 5400 RPM; 4 IPI disks on Convex
File Cache Performance • UNIX File System Performance: not how fast disk, but whetherdisk is used (File cache has 3 to 7 x disk perf.) • 4X speedup between generations; DEC & Sparc Fast Mem Sys DEC Generations Sun Generations
File Cache Size • HP v8 (8%) vs. v9 (81%); DS 5000 Ultrix (10%) vs. Sprite (63%)
File System Write Policies • Write Through with Write Buffer (Asynchronous): AIX, Convex, OSF/1 w.t., Solaris, Ultrix Fast File Caches for Reads Fast Disks MB/sec
File System Write Policies Write Cancelling (Write Back): HP/UX no write daemon (v. 30s); must wait for write to complete when flushed MB/sec
Write policy Performance For Client/Server Computing • NFS: write through on close (no buffers) • HPUX: client caches writes; 25X faster @ 80% reads FDDI Network MB/sec Ethernet
UNIX I/O Performance Study Conclusions • Study uses Willy, a new I/O benchmark which supports self-scaling evaluation and predicted performance. • The hardware determines the potential I/O performance, but the operating system determines how much of that potential is delivered: differences of factors of 100. • File cache performance in workstations is improving rapidly, with over four-fold improvements in three years for DEC (AXP/3000 vs. DECStation 5000) and Sun (SPARCStation 10 vs. SPARCStation 1+). • File cache performance of Unix on mainframes and minisupercomputers is no better than on workstations. • Current workstations can take advantage of high performance disks. • RAID systems can deliver much higher disk performance. • File caching policy determines performance of most I/O events, and hence is the place to start when trying to improve I/O performance.