Download
1 / 19
190 likes | 213 Views
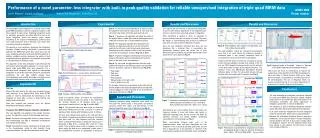
Run-specific limits of quantitation and detection (an alternative to minimum peak height thresholds). Forensic Bioinformatics (www.bioforensics.com). Dan E. Krane, Wright State University, Dayton, OH. Sometime signal is easy to recognize. Sometimes signal is hard to distinguish from noise.

E N D
Run-specific limits of quantitation and detection(an alternative to minimum peak height thresholds) Forensic Bioinformatics (www.bioforensics.com) Dan E. Krane, Wright State University, Dayton, OH
Sometimes signal is hard to distinguish from noise Can “Tom” be excluded? SuspectD3vWAFGA Tom 17, 17 15, 17 25, 25
Sometimes signal is hard to distinguish from noise Can “Tom” be excluded? SuspectD3vWAFGA Tom 17, 17 15, 17 25, 25 No -- the additional alleles at D3 and FGA are “technical artifacts.”
Sometimes signal is hard to distinguish from noise Can “Dick” be excluded? SuspectD3vWAFGA Tom 17, 17 15, 17 25, 25 Dick 12, 17 15, 17 20, 25
Opportunities for subjective interpretation? Can “Dick” be excluded? SuspectD3vWAFGA Tom 17, 17 15, 17 25, 25 Dick 12, 17 15, 17 20, 25 No -- stochastic effects explain peak height disparity in D3; blob in FGA masks 20 allele.
Sometimes signal is hard to distinguish from noise Can “Harry” be excluded? SuspectD3vWAFGA Tom 17, 17 15, 17 25, 25 Dick 12, 17 15, 17 20, 25 Harry 14, 17 15, 17 20, 25 No -- the 14 allele at D3 may be missing due to “allelic drop out”; FGA blob masks the 20 allele.
Sometimes signal is hard to distinguish from noise Can “Sally” be excluded? SuspectD3vWAFGA Tom 17, 17 15, 17 25, 25 Dick 12, 17 15, 17 20, 25 Harry 14, 17 15, 17 20, 25 Sally 12, 17 15, 15 20, 22 No -- there must be a second contributor; degradation explains the “missing” FGA allele.
What can we learn from Tom, Dick, Harry and Sally? • No one can be excluded as a contributor to some evidence samples -- largely because of difficulty distinguishing between signal and noise. • Interpretation standards can be flexible (especially for distinguishing between noise, artifacts and signal)
Where do peak height thresholds come from? • “Conservative” thresholds established during validation studies • Eliminate noise (even at the cost of eliminating signal) • Can arbitrarily remove legitimate signal • Contributions to noise vary over time (e.g. polymer and capillary age/condition) • Analytical chemists use LOD and LOQ
Signal Measure Saturation Quantization limit μb + 10σb Measured signal (In Volts/RFUS/etc) μb + 3σb Detection limit Mean background Signal μb 0
Variation in baseline measures can be determined very well • Negative controls: 5,932 data collection points (DCPs) per run ( = 131 DCPs) • Reagent blanks: 5,946 DCPs per run ( = 87 DCPs) • Positive controls: 2,415 DCP per run ( = 198 DCPs) • DCP regions corresponding to size standards and 9947A peaks (plus and minus 55 DCPs to account for stutter in positive controls) were masked in all colors
Variation in baseline noise levels Average (μb) and standard deviation (σb) values with corresponding LODs and LOQs from positive, negative and reagent blank controls in 50 different runs. BatchExtract: ftp://ftp.ncbi.nlm.nih.gov/pub/forensics/
Reviewer comments: • “What does it add if there is another profile present at a low (presumably undetectable by present methods) level?” • “. . . .explain why finding of such a ‘contaminating’ low-level profile would change the interpretation of the case.”
Lines in the sand: a two-person mix? Two reference samples in a 1:10 ratio (male:female). Three different thresholds are shown: 150 RFU (red); LOQ at 77 RFU (blue); and LOD at 29 RFU (green).
Resources • Internet • Forensic Bioinformatics Website: http://www.bioforensics.com/ • National Center for Biotehnology Information (NCBI): ftp://ftp.ncbi.nlm.nih.gov/pub/forensics/ (BatchExtract) • Publications • ‘Sample size and major, minor, trace, and ultratrace components. Contemporary instrument analysis’ by Rubinson and Rubinson (Prentice Hall, 2000, pp 150-158). • ‘Limit of detection (LOD)/limit of quantitation (LOQ): comparison of the empirical and the statistical methods exemplified with GC-MS assays of abused drugs’ by Arinbruster, Tillman and Hubbs (Clinical Chemistry, 1994, 40:1233-1238). • Scientists • Jason Gilder (Forensic Bioinformatics) • Travis Doom (Wright State, Dayton, OH) • Keith Inman (Forensic Analytical, Haywood, CA) • Journal of Forensic Sciences • Accepted for publication, to appear in the January 2007 issue.