Download
1 / 33
340 likes | 501 Views
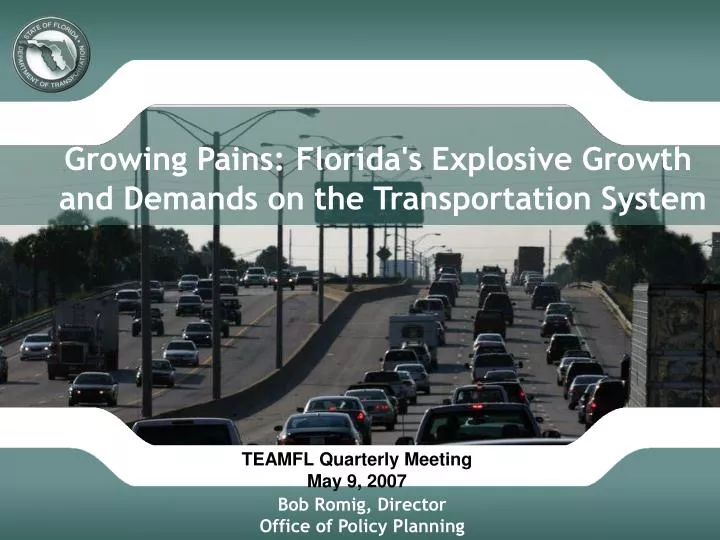
Growing Pains: Florida's Explosive Growth and Demands on the Transportation System. FDOT PowerPoint Example. TEAMFL Quarterly Meeting May 9, 2007. Bob Romig, Director Office of Policy Planning. Today’s Presentation. Travel Demand Measures of Mobility How Will We Respond?.

E N D
Growing Pains:Florida's Explosive Growth and Demands on the Transportation System FDOT PowerPoint Example TEAMFL Quarterly MeetingMay 9, 2007 Bob Romig, Director Office of Policy Planning
Today’s Presentation • Travel Demand • Measures of Mobility • How Will We Respond?
Today’s Presentation • Travel Demand • Population Growth • Travel Demand • Tourists and Visitors • Trade and Freight • Measures of Mobility • How Will We Respond?
Population Growth Growth Continues Source: U.S Census Bureau; Bureau of Economic and Business Research (BEBR), University of Florida; Florida Department of Transportation (FDOT).
Comparative Growth Rate More Than Double the National Average Source: U.S. Census Bureau, Historical Census 1970-2000
Components of Population Growth Immigration Drives Growth Average Annual Growth (thousands) Source: U.S. Census Bureau
Total Registered Vehicles Vehicle Ownership is Increasing Source: Federal Highway Administration (FHWA), Highway Statistics Series
Principal Travel Mode to Work Driving Alone Dominates Source: Census, American Community Survey 2004
Visitor Growth Source: Florida Department of Transportation using Visit Florida data.
Trade and Freight 68 Percent of Freight is Shipped Within Florida Exports72M tons Imports200M tons Within Florida575M tons
Freight Shipments To, From, and Within State Roadway is Primary Mode of Transport in Florida Source: FHWA, Office of Freight Management and Operations, Florida Freight Transportation Profile, 2002
Truck Tractor Registrations Truck Registrations Have Skyrocketed Since 2000 Source: FHWA, Highway Statistics Series, Motor Vehicles, Truck Tractor Registrations.
Today’s Presentation • Travel Demand • Measures of Highway Mobility • Vehicle Miles Traveled • Lane Miles Added • Congestion • Person-hours of Delay • How Will We Respond?
Daily Vehicle Miles Traveled Largest Share in 7 Largest Counties DVMT (Million) Source: Florida Highway Data Source Book, FDOT Transportation Statistics Office.
Daily Truck Miles Traveled Largest Share in Non-Urbanized Areas DTMT (Million) Source: Florida Highway Data Source Book, FDOT Transportation Statistics Office.
Delay Trends: Lane Miles Added (FIHS) Florida Intrastate Highway System Percentage difference relative to 1995 Lane Miles Source: Florida Highway Data Source Book, FDOT Transportation Statistics Office.
Congested Mileage in Peak Hours (FIHS) Most Congested Miles in Urbanized Areas % Miles Congested During Peak Hours Source: Florida Highway Data Source Book, FDOT Transportation Statistics Office.
Congested Travel in Peak Hours (FIHS) More Congested Trips in Urbanized Areas % Travel Congested During Peak Hours Source: Florida Highway Data Source Book, FDOT Transportation Statistics Office.
Duration of Congestion (FIHS) Congestion Lasts Longerin Urbanized Areas Daily Duration of Congestion (Hour) Source: Florida Highway Data Source Book, FDOT Transportation Statistics Office.
Delay Trends: "Delay" Defined • Definition: Delay is the difference between normal travel time and actual travel time (at estimated average speed) • Objective: Maintain the average growth rate at or below 5%
Delay Trends: Person-hours of Delay Person-Hours of Delay Percentage difference relative to 1995 Person-Hours of Delay Daily VMT Population Lane Miles Source: Florida Highway Data Source Book, FDOT Transportation Statistics Office. BEBR, University of Florida. Florida Department of Transportation.
Delay Trends: Largest Counties 7 Largest Counties Percentage difference relative to 1995 Person-Hours of Delay Daily VMT Population Lane Miles Source: Florida Highway Data Source Book, FDOT Transportation Statistics Office. BEBR, University of Florida. Florida Department of Transportation.
Delay Trends: Other Counties 60 Other Counties Percentage difference relative to 1995 Person-Hours of Delay Daily VMT Population Lane Miles Source: Florida Highway Data Source Book, FDOT Transportation Statistics Office. BEBR, University of Florida. Florida Department of Transportation
Delay By District (FIHS) Delay Is Steadily Increasing Person Hours of Delay Source: Florida Highway Data Source Book, FDOT Transportation Statistics Office.
Today’s Presentation • Travel Demand • Measures of Mobility • How Will We Respond?
How Will We Respond? Safety Mobility Options
How Will We Respond? • Safety • Implement the Strategic Highway Safety Plan • Aggressive Driving/Driving Under the Influence • Increase Seat Belt Use • Improved Bicycle and Pedestrian Safety • High Accident Intersections and Vehicle Run-Off and Cross Over Locations
How Will We Respond? • Improve Mobility • Maximize the capacity of the existing transportation systems • Technological/Operational Improvements • Focus funding on congested corridors and "bottlenecks" • Improve Timeliness of Project Development and Delivery • Look at Short-term and Long-term Funding Options
How Will We Respond? • Mobility Options • Managed Lanes/Hot lanes • Invest in Public Transportation • Support local transit initiatives • Bus Rapid Transit (BRT) • Increased "Regional" Emphasis • Consider new corridors and alternatives to "built out" corridors