Download
1 / 81
820 likes | 995 Views
Maximizing Your Assessment by Combining Student Survey Results: EBI, NSSE, and CIRP. Jillian Kinzie, Ph.D. Associate Director, Center for Postsecondary Research and National Survey of Student Engagement (NSSE) Institute John Pryor, M.A.

E N D
Maximizing Your Assessment by Combining Student Survey Results: EBI, NSSE, and CIRP Jillian Kinzie, Ph.D. Associate Director, Center for Postsecondary Research and National Survey of Student Engagement (NSSE) Institute John Pryor, M.A. Director, Cooperative Institutional Research Program, Higher EducationResearch Institute Darlena Jones, Ph.D. Director of Research and Development, Educational Benchmarking
Session Objectives • Introduction • Overview of CIRP, NSSE, and EBI • Data Triangulation • Using Studies to Measure… • Retention • Integration to Campus • First-Year Program Improvement • Learning Outcomes • Using Multiple Data Sources • Other Data Considerations • Small Group Discussion
CIRP: Cooperative Institutional Research Program What is CIRP?
Introduction CIRP surveys have been used for decades to understand and illustrate the impact of college. Can use the surveys as cross-sectional surveys, but the key advantage of CIRP surveys is that they are longitudinal.
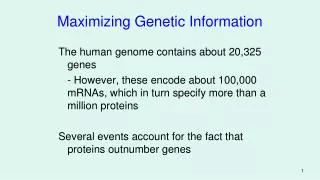
Astin’s I – E – O Model Environments YFCY/CSS (e.g., place of residence during college, interactions with peers and faculty, curricular and co-curricular experiences) Inputs CIRP Freshman Survey (e.g., academic performance in high school, financial concerns prior to college entry, expectations for college, degree aspirations, self-concept in high school) Outcomes YFCY/CSS (e.g., satisfaction with college, retention, gains in college, post-college plans)
Higher Education Research Institute at UCLA Cooperative Institutional Research Program Funded Research Freshman Survey YFCY CSS • Ford Foundation • Templeton Foundation • National Institutes • of Health Faculty Survey
CIRP Freshman Survey (TFS) • Largest and longest-running national study of American college students…2008 is 43nd administration • Initiated in 1966 at the American Council on Education; Housed at HERI (UCLA) since 1973
CIRP Freshman Survey (TFS) • Three types of input items: • Pretests on possible outcomes measures • Self-predictions about possible future outcomes • Personal characteristics that might effect the propensity to attain certain outcomes
2007 1966 206,865 respondents 251 Colleges and Universities • 374,261 respondents • 536 • Colleges • and • Universities • Total over 42 years: • 13,408,942 students • 1,708 colleges and universities
Your First College Year (YFCY) • Launched in 2000 • 208,157 students at 378 schools • Designed to assess academic and personal development over the first year of college • Developed in collaboration with the Policy Center on the First Year of College
Your First College Year Survey (YFCY) • Mission: Longitudinal assessment of student development and institutional/programmatic impact during the first year of college • Study Launch: Pilot Studies in Spring 2000 & 2001; National Assessment launched in Fall 2002 • Data Collected: Since its inception, surveyed nearly 150,000 first-year students at nearly 250 institutions nationwide • Administration: Disseminated at end of the first year in an on-campus administration format; paper and/or web versions; overall response rates 35-82%.
YFCY… • Comprehensive in content to assess academic & social experiences as well as cognitive & affective development • Designed as a follow-up instrument: • 40% of items are direct post-tests to questions on the CIRP Freshman Survey • Survey Content • Academic achievement & engagement • Learning strategies and pedagogical practices • Residential & employment experiences • Interactions with family, peers, faculty & staff • Patterns of behavior • Student values and life goals • Satisfaction, self-concept, & feelings of personal success • Plans for the next academic year • Space for 20 questions of local relevance
Standard Deliverables Institutional Profile Longitudinal Profile Electronic Data File Reports on Spreadsheet Additional Data Services Institutional Data in PowerPoint Executive Summary Peer Group Reports Data Merges YFCY Deliverables and Data…
Methodologies Descriptive analyses with campus data Comparative analyses Institutional subgroups Institutional vs. national data Aspirant group or consortium Measures of association Factor analyses Trends analyses Multivariate analyses Purposes Self-study reports & strategic planning Retention studies Examining group differences among students Programmatic assessment Measuring student development & institutional impact Feedback to campus constituents Creation of a student information system Using YFCY Data to Enhance Campus Assessment Efforts
NSSE: National Survey of Student Engagement Who is NSSE?
NSSE Stats… • Launched in 2000, supported by institutional participation fees • Parent survey CSEQ (1979) • National design team created survey • Administered by Indiana University Center for Postsecondary Research • More than 1,300 different baccalaureate colleges/universities from 50 states, Puerto Rico, and Canada (CCSSE is for 2-year institutions) • Consortia can add up to 20 questions (e.g., women’s colleges, HBCUs, state systems) • Spring administration to first-year & senior students • Third party, standardized administration; average 40% response rate, random sample, and select comparison groups.
NSSE Purposes • Provide reliable indicators of “good educational practices” • Support institutional improvement and accountability efforts • Foster comparative & consortium activity • Refocus conversations about quality in undergraduate education • Direct measure of frequency of participation in educational practices associated with learning and development.
Survey Instrument College student survey that assesses the extent to which students engage in educational practices associated with high levels of learning and development
Two Components of Student Engagement • What students do – time and energy devoted to educationally purposeful activities • What institutions do – using effective educational practices to induce students to do the right things
NSSE Reports • Comparative data (National, Carnegie Class, Select Comparison Groups, and/or Consortium) • RespondentCharacteristics • Frequency Distributions • Mean Comparisons • Benchmark Comparisons • Multi-year Benchmark Comparisons • Pocket Guide Report (for prospective students) • Executive Snapshot Report • Data File [so you can link to other data!!]
BCSSE – Beginning College Survey of Student Engagement • Based on requests for related pre-college measures • Measures selected high school experiences and students interest in and expectations for participating in educationally purposeful activities during college • Designed to be combined with spring NSSE data for “pre- and post”- views of the first-year experience; Use to examine gap between expectations and engagement and study effect of students’ background on NSSE scores • Can also be used as stand alone assessment • Pilots in 2005, 2006; Officially launched in 2007
Merging NSSE data with school records Descriptive displays of engagement patterns by any number of student characteristics Prediction models for retention, degree attainment, grades, other outcomes Tracking student engagement year to year Comparisons against aspirational, regional, and mission-related institutions Program assessment Accreditation reporting Consortium and system data sharing Scholarly research NSSE Possibilities
EBI: Educational Benchmarking, Inc. Who is EBI?
EBI Stats… • Founded in 1994 by Joseph Pica, Ed.D and Glenn Detrick (retired in 2002) • Over 1500 Colleges and Universities (U.S.A. and 15 other countries like Australia, Mexico, Spain, and Egypt) have participated in EBI’s studies • Surveyed over 12 million people • Nearly 100 Assessments in 10 areas of higher education • Over 500 custom assessments for schools like MIT, Ohio State, UCLA, University of Georgia, and University of Florida • Produced over 17,000 customized reports • Creation of WESS
EBI’s Partners (alphabetical order) AACN(American Association of Collegiate Nursing) ACUHO-I(The Association of College and University Housing Officers International) ACUI(Association of College Unions International) AFA(Association of Fraternity Advisors) Ball State University– MHLI(Military Housing and Lodging Institute) OTC(Outside the Classroom) Policy Center on the First Year of College
Relevant Assessments… EBI First-Year Initiative (FYI) • Mission: To assess the effectiveness of first-year courses / seminars. • Survey Development: Created in conjunction with the Policy Center for the First Year of College. Initial funding of project by the Pew Charitable Trusts. Currently funded by institution participation. • Study Stats: Pilot Study in Spring 2001; National Assessment launched in Fall 2001. 169 colleges and universities have submitted over 185,000 responses. • Why Participate: Provides institution information on course effectiveness. Provides instructors’ their class results for individual improvement. f
Relevant Assessments… ACUHO-I/EBI Resident Assessment • Mission: To assist college and universities in assessing resident satisfaction of residence hall functions and the effectiveness of residence hall life. • Survey Development: Created in conjunction with ACUHO-I. Housing professionals collaborated with EBI to design survey questions. • Study Stats:National Assessment began Spring 1998. Since then, 567 colleges and universities worldwide have submitted over 2.6 million responses. • Why Participate: Provides evidence of student satisfaction of their on-campus living experience and student learning outcomes linked to CAS Standards.
Relevant Assessments… MAP-Works • Mission: An early warning indicator of retention and student success • Survey Development: Created in conjunction with Ball State University. Sherry Woosley from BSU collaborated with EBI to design survey questions. • Study Stats:Study piloted in 2006 – full national study in 2007. Over 40 institutions are utilizing MAP-Works in 2008 • Why Participate: Provides reporting directly to each first-year student regarding their behaviors benchmarked against their first-year cohort. Provides information directly to advisors, hall directors, and FYE instructors regarding their students so early intervention can occur.
Relevant Assessments… FoE/EBI Foundation of Excellence Student and Faculty/Staff Assessments • Mission: Assist campus professionals in the self-study of their first-year program in support of the Foundations of Excellence • Survey Development: Created in conjunction with the Policy Center on the First Year of College. Randy Swing, John Gardner, and Betsy Barefoot collaborated with EBI to design survey questions. • Study Stats:Studies piloted Summer 2005. National Assessment launched Fall 2005.Since 2005, 67 schools have participated in the 4 year study and 39 schools have participated in the 2 year study.
Assessment Features… General Features… • Professional Survey Development:EBI’s survey development team working in partnership with professional organizations • Data Collection: Paper surveys (where available) or online • WESS: State-of-the art data collection, reporting, and distribution system. Programmed and maintained by EBI software engineers. • View Reports Online: Provides visualizations of results and ability to download responses and/or calculated data for higher-level analysis • Share Reports Online: Ability to allow access to online reporting to others • Written Analysis: Analysis notebooks with full detailed descriptive analysis (factor and question means, frequency distributions, etc.) Analysis also available online in PDF format.
Assessment Features… Comparisons… • Inter-Institutional Comparisons: Provide comparative information for high level decision-making and resource allocation • Intra-Institutional Comparisons: The ability to code units (areas/hall/floors, chapters, or course sections) for internal comparison to support internal improvement • Longitudinal Comparisons: Provide trend data to assess the impact of initiatives Customization… • Statistical Analysis:Provides statistical testing and information for resource allocation • Institutional Specific Questions: Institutions may add up to 10 questions (5 can be open-ended if using our online surveying system, WESS)
What Is Data Triangulation? • Application and combination of several data points or sources to overcome weaknesses of single-measure studies Why Use Data Triangulation? • Increase confidence in findings through convergence of different perspectives • The point at which perspectives converge is seen to represent reality • Builds a rich data resource
Astin’s I-E-O Model Environments CSS, YFCY, EBI, NSSE (e.g., place of residence, interactions with peers and faculty, engagement, programmatic features, curricular & co-curricular experiences) Inputs CIRP Freshman, BCSSE, MAP-Works (e.g., academic performance in high school, financial concerns prior to college entry, expectations for college, degree aspirations, self-concept in high school) Outcomes YFCY, CSS,EBI, NSSE (e.g., post-college aspirations, satisfaction with college, academic and social adjustment, degree completion rates)
Similarities and Differences Comparing these instruments, we’ll be answering the questions... • What are the unique features of these instruments? • What are the similarities between these instruments? • What are the differences between these instruments? • How do these instruments complement each other? Next, how these instruments address… • Retention • Integration • Learning Outcomes • First Year Program Improvement
NSSE and Retention… • Links between NSSE & Retention Goals: • NSSE is a stimulus for reflection on what the institution does well & areas for improvement • Focuses attention on ultimate goal of persistence – improved educational experiences (not just retention) • Identifies what distinguishes the institution, where • Student experience matches espoused mission • Student experience falls short • NSSE results can be connected to institutional data to build persistence models
NSSE and Retention… NSSE items and Tinto’s Model of Student Persistence • Students engagement in effective educational practices as indication of level of academic & social integration (1a-v; 6a-f; 9a-g etc.) • Institutional environment items indicate the level of commitment to student success (10a-g) • Student intentions to engage in educational activities before graduating (7a-h)
NSSE and Retention… • Retention Indicators • Monitor satisfaction • Examine intent to engage in enriching educational experiences • Identify problematic student behaviors (e.g., % preparing for class; % preparing 2 or more drafts; frequency of contact with faculty outside of class) • Retention Studies • Study relationship between engagement and first-year retention • Compare persisters vs. non-persisters • Study program impact (e.g., first-year learning communities; course-based service experience)
CIRP and Retention… • CIRP Freshman Survey asks students to predict the likelihood that they will transfer, stop-out, or leave • YFCY asks if they have transferred from a different institution; CIRP TFS pre-test data will be merged with the YFCY responses even if the pre-test was administered at a different institution • YFCY asks students to share their plans for their sophomore year, i.e., intent to re-enroll • Data can be merged with information from the registrar to compare predicted vs. actual retention rates
CIRP and Retention… • One of the biggest problems with studying retention is that it is inextricably linked with who you admit (pre-college characteristics and performance) • Longitudinal assessment (e.g. CIRP Freshman Survey and YFCY) allows institutions to control potentially-biasing background characteristics when assessing first-to-second year retention rates “Many of the so-called highly productive institutions turn out to be underproductive when the caliber of their entering students is taken into account.” Alexander Astin, 2003
CIRP and Retention… Consideration of “inputs” and “environments” in retention analyses identifies populations of at-risk students and programs/experiences that facilitate or inhibit persistence • Ex. What entering characteristics positively predict first-to-second year enrollment?Emotional health is a positive predictor, but recent cohorts of students are exhibiting more stress & greater levels of depression • Ex. How do service-learning, first-year seminars, and learning communities affect the decision to re-enroll?Service learning is a positive predictor on its own; First-year seminars and learning communities are effective when taken in combination
EBI and Retention… Enrollment Management/Retention • Who is responsible for student success on your campus? • Enrollment Management/ Retention? • Student Affairs? • Academic Affairs? • What information do you know about this first-year student? Academic Affairs Student Affairs Student ID: YD252952HS GPA: 3.93SAT Verbal: 29Location: In stateGender: FemaleRace: African AmericanAge: 18Major: Undecided Do you really know them?
Enrollment Management / Retention Academic Advisor First-Year Seminar Instructor Academic Department Heads Financial Aid Minority Student Affairs Paradigm Shift EBI and Retention… I’m struggling in my math class I’m thinking about transferring Student Affairs • What would happen if… • ALL faculty/staff were responsible for student success? • YOU knew student was struggling? • Could you do something about it before it was too late? Academic Affairs Residence Hall Staff I’m really homesick I don’t think I can afford college My roommate and I argue all the time
Expectations • Behaviors • Student Profile • Institution Profile • Campus Resources • Social Norming • Expectations • Campus • Resources • Student Summary • Scan Students MAP-Works Process
NSSE and Engagement… What is the level of student engagement on your campus? • NSSE data demonstrates what students do and what students believe the institution emphasizes • Results can be used to shape new student behavior • Criterion reference benchmarking to compare against predetermined value (e.g., 20% FY students worked with peers on assignments outside of class – should this be higher??)
CIRP and Student Involvement Astin’s Involvement Theory • The amount of student learning and development associated with any educational program is directly proportional to the quantity and quality of student involvement in that program • The effectiveness of any educational policy or practice is directly related to the capacity of that policy or practice to increase student involvement